6
Creating a Monitor Mix with Aux Bus 2
The Aux 2 bus normally sends input channel signals to the M-16DX’s
internal effects. When you use it instead for a monitor mix, the
internal effect processor is automatically turned off.
Sending the Aux 2 Signal to the Stage
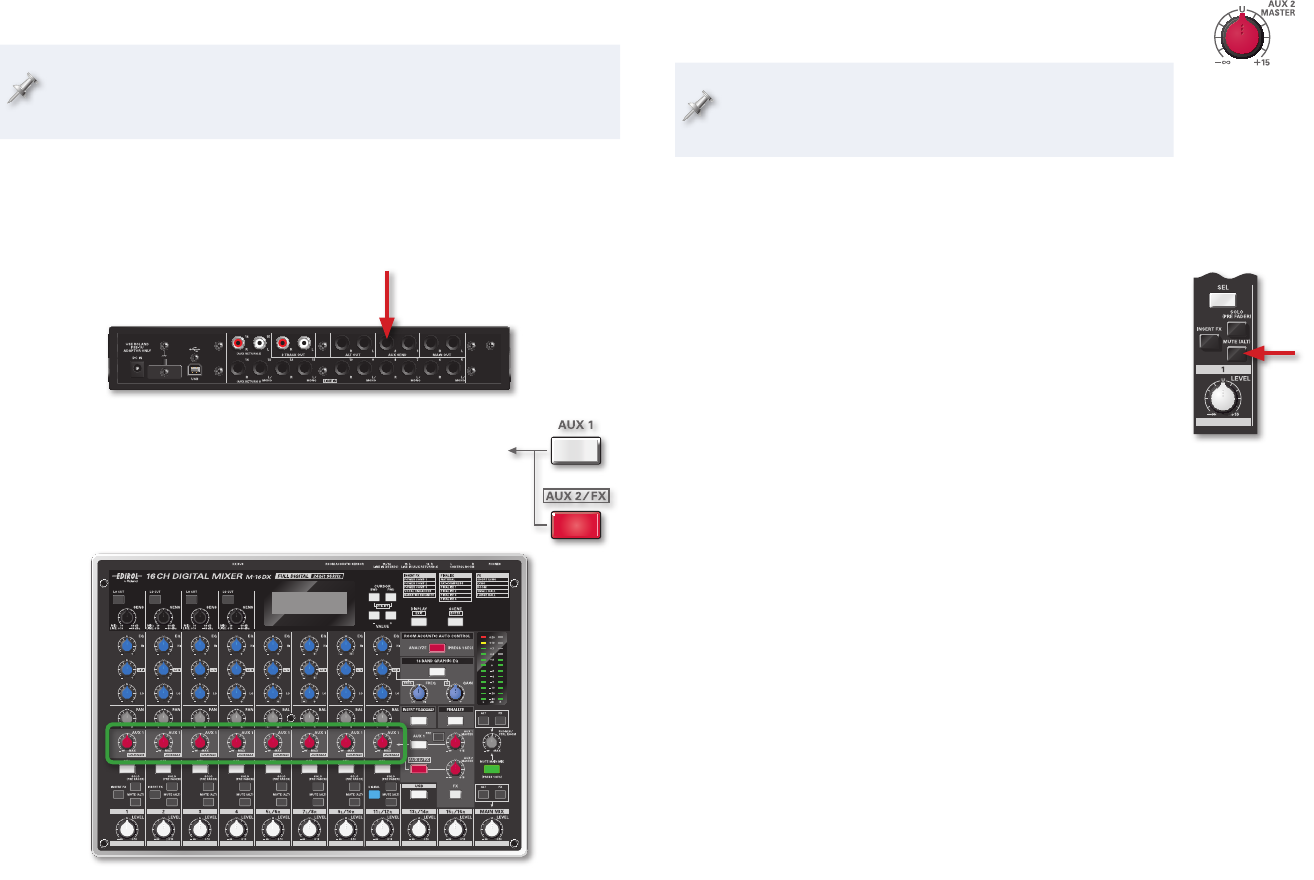
The Aux 2 bus is a mono bus, like Aux Bus 1. Connect the AUX SEND 2 output
jack to your monitor speaker power amp or in-ear/headphone amp.
Creating an Aux 2 Monitor Mix
Press AUX 2 so it lights—• designating the channel-
strip AUX 1 knobs as sends to the Aux 2 bus.
Adjust each input level—
• using its AUX 1 knob.
When the AUX 2 button is lit, each channel’s AUX 1 knob
sends the channel’s signal to the Aux 2 bus.
Control the overall level of the monitor mix—• with the
AUX 2 MASTER knob.
A reminder: You can configure the channel-strip AUX
SEND 1 knobs as Aux 1 sends or Aux 2 sends at any time
by pressing the AUX 1 or AUX 2 button, as desired.
Creating a Monitor Mix with the Alt Bus
The Basic Idea
The basic idea of the Alt bus is that you can remove
input signals from the main mix by muting them, which
re-routes them to the Alt bus. You can add the signals on
the Alt bus back to the main mix, or not, as your needs
dictate, or use them as a separate feed. The applications
on Page 7 demonstrate what we mean.
The Alt Bus is a Post-Style Bus
The Alt bus gets its signal post-fader, so each of its signals
can be EQ’d—
• using its channel strip’s EQ.
can use an insert effect—
• if it’s going through Input Channel 1 and 2.
can be positioned in the Alt bus stereo image—
• using its channel strip’s
PAN or BALANCE knob.
has its volume set—
• by the channel-strip LEVEL knob.
Connecting to the Alt Bus
You can send the Alt bus to a monitor power amp or in-ear/headphone amp
directly from the M-16DX rear-panel ALT OUT L and R jacks if you like.
A better option for live mixing—where you don’t need a separate control-
room feed as you would in a studio context—is to use the CONTROL ROOM
L and R jacks for your Alt bus monitor mix instead, for a few reasons.