69
Standard programs
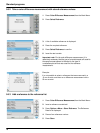
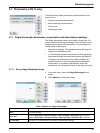
5.6.1.1 View graph/table/values
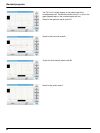
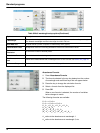
1. Press Options > View Graph to display the transmittance
graph for the sample (black line) and the reference (red line)
in the wavelength range of 380 nm to 720 nm on the x-axis
and the % transmittance on the y-axis.
In the middle of the graph a dotted cursor line is displayed.
Below the graphic, the transmission difference between
reference and sample on the current cursor position is
displayed.
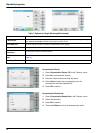
2. Press the appropriate button on the right screen to move the
cursor line left or right or touch any position inside of the
graph area. In the middle of the x-axis the wavelength at the
actual cursor position is displayed.
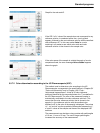
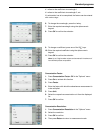
3. Press Options > More > Scale & Units > Ext. A graph
showing the absorbance curve for the measurement is
displayed. Below the graph diagram, the absorption
difference is displayed.
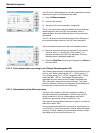
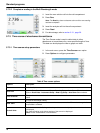
4. Press Options > View Table to switch to the table of
transmittance values or absorbance values (depending on
the option selected in "Scale & Units").
There are three columns in which the wavelengths 380 nm to
580 nm and the corresponding transmittance/absorbance are
displayed.
Scroll down to display the transmittance and absorbance
wavelengths up to 720 nm.
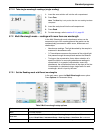
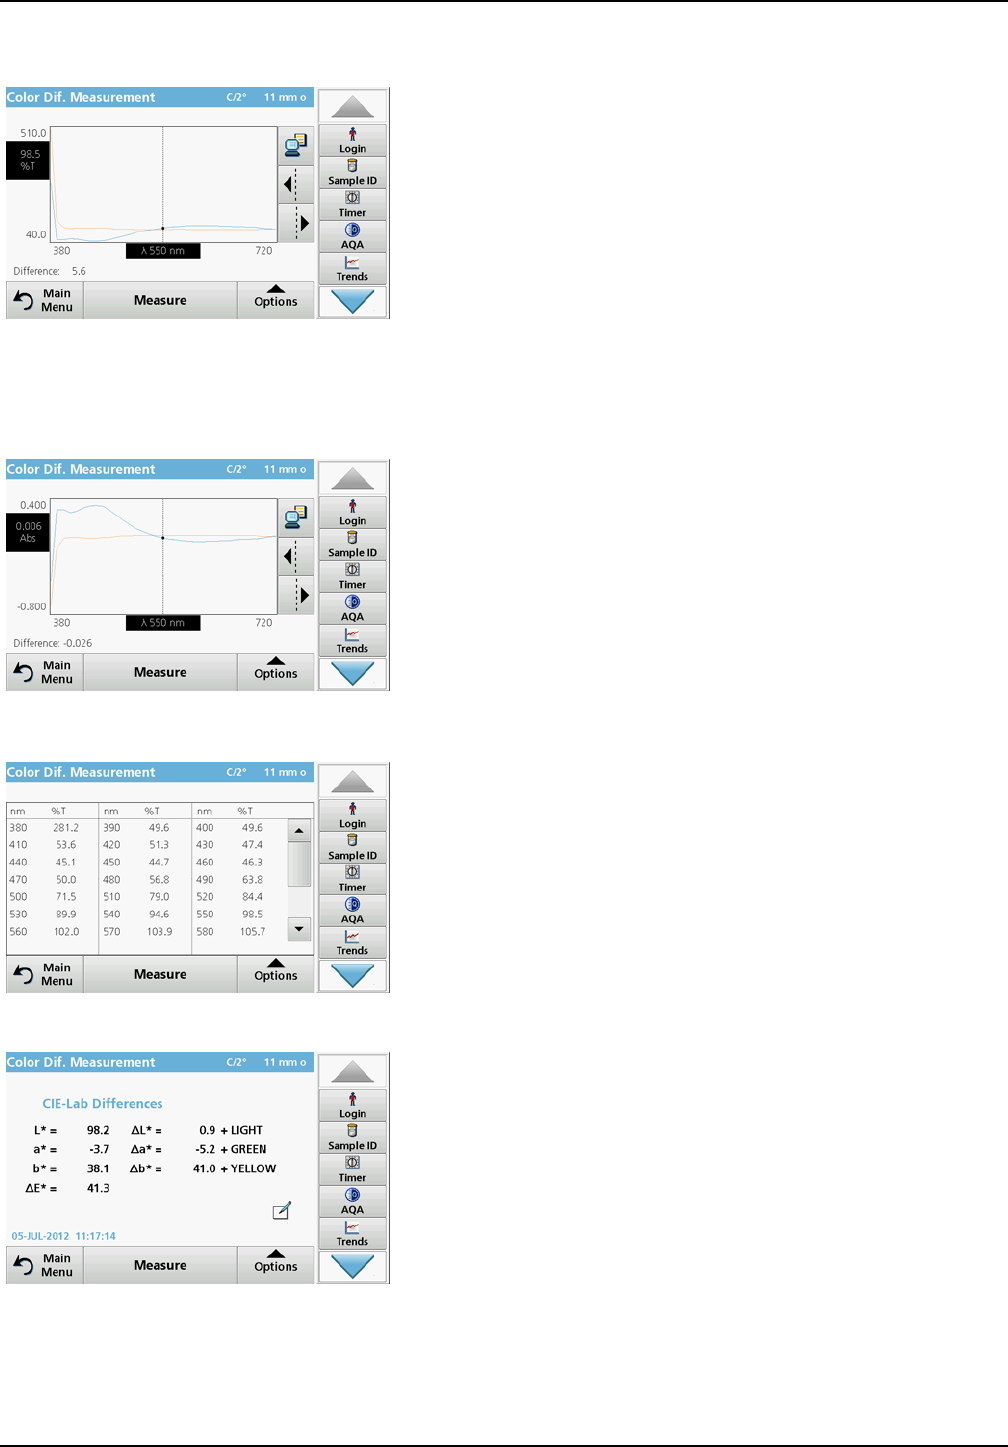
5. Press Options > View Values. The color value of the sample
is displayed.


