20070201
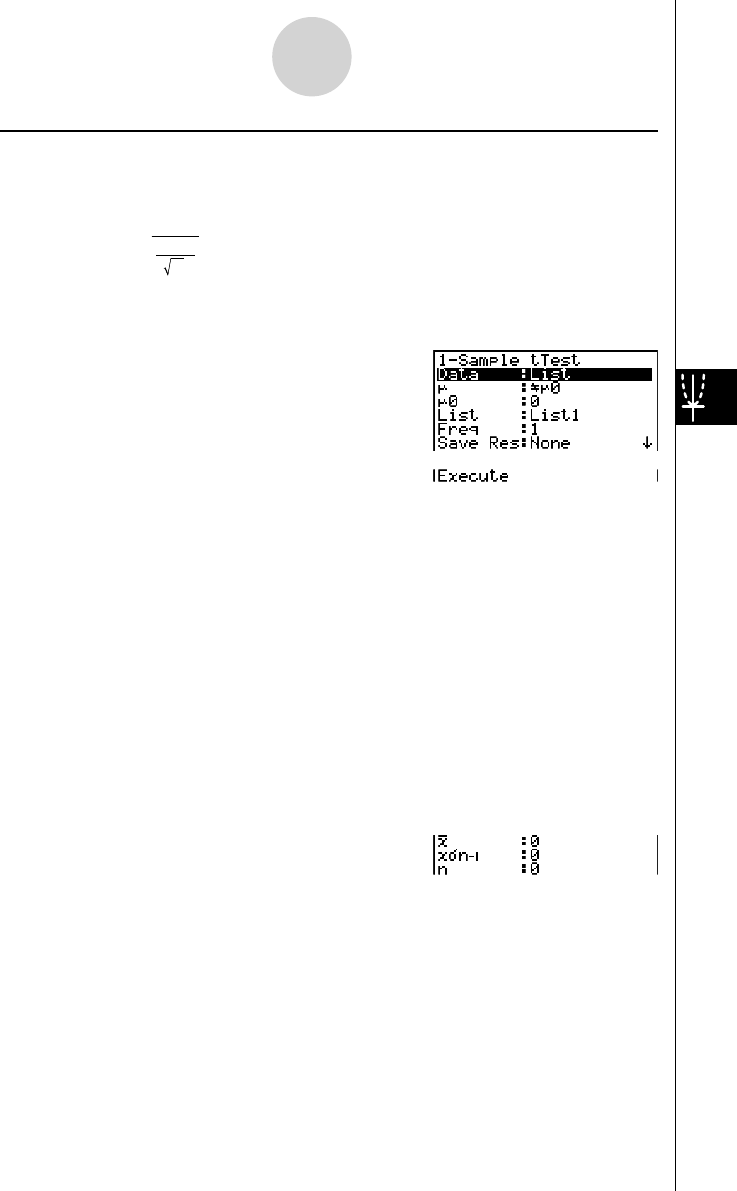
u 1-Sample t Test
This test uses the hypothesis test for a single unknown population mean when the population
standard deviation is unknown. The 1-Sample
t Test is applied to t -distribution.
¯ x : mean of sample
μ
0 : assumed population mean
x
σ
n -1 : sample standard deviation
n : size of sample
Perform the following key operations from the statistical data list.
3 (TEST)
2 (t)
1 (1-S)
The following shows the meaning of each item in the case of list data specifi cation.
Data .............................. data type
μ
..................................population mean value test conditions (“G
μ
0 ” specifi es two-
tail test, “<
μ
0 ” specifi es lower one-tail test, “>
μ
0 ” specifi es
upper one-tail test.)
μ
0 ................................. assumed population mean
List ............................... list whose contents you want to use as data (List 1 to 26)
Freq .............................. frequency (1 or List 1 to 26)
Save Res ......................list for storage of calculation results (None or List 1 to 26)
Execute ........................executes a calculation or draws a graph
The following shows the meaning of parameter data specifi cation items that are different
from list data specifi cation.
¯ x ..................................mean of sample
x
σ
n -1 ............................. sample standard deviation ( x
σ
n -1 > 0)
n .................................. size of sample (positive integer)
After setting all the parameters, use c to move the highlighting to “Execute” and then press
one of the function keys shown below to perform the calculation or draw the graph.
• 1 (CALC) ... Performs the calculation.
• 6 (DRAW) ... Draws the graph.
t =
o –
0
μ
σ
x
n–1
n
t =
o –
0
μ
σ
x
n–1
n
6-5-11
Tes ts