Embedded Module for Blackfin Processors 24 ni.com
Debugging with Breakpoints and Probes
Complete the following steps to debug the Blackfin tutorial application
with breakpoints and probes.
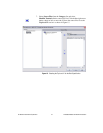
1. Switch to the block diagram if it is not visible.
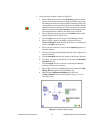
2. Right-click the Multiply function and select Set Breakpoint from
the shortcut menu. The breakpoint is highlighted with a red border
around the function. When you run the Blackfin application, execution
pauses just before the function executes. If you are using JTAG or
USB/EZ-KIT for debugging, LabVIEW might prompt you to halt the
processor.
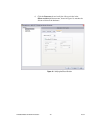
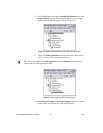
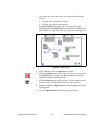
3. Right-click Debug configuration in the Project Explorer window
and select Debug from the shortcut menu. LabVIEW prompts you to
save changes to the VI. LabVIEW also prompts you if you need to
rebuild or redownload the Blackfin application to the Blackfin target.
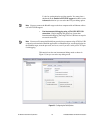
Tip LabVIEW uses default values for controls and indicators when building a Blackfin
VI into a Blackfin application. To change the initial values, enter the new values in the front
panel controls and then select Edit»Make Current Values Default to change the initial
values. You must rebuild the Blackfin application after you change the initial values of the
controls.
The Blackfin tutorial application begins running on the Blackfin target.
When you reach a breakpoint during execution, the Blackfin target
halts all operation, the application pauses, and the Pause button, shown
at left, appears red and changes to a Continue button.


