


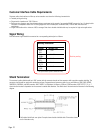
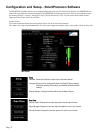
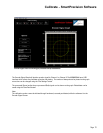

Encoder Signal Data Plot showing pre-porcessed and processed data.
The Encoder Signal Graph will plot the encoder signal for Channel 1 or Channel 2. The M3000SiDAA has a USB
interface which allows very fast data collection and plotting. The number of data points to be plotted on the graph
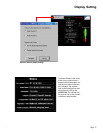
at one time can be changed using the "Plot Settings" button.
The processed (Green) and/or the pre-processed (Red) signals can be shown on the graph. Plotted data can be
saved using the "Save Data" button.
Note:
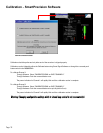
The calibration routine cannot be initiated through hardware (recessed push button) while the software is in the
Encoder Signal Screen.
Calibrate - SmartPrecision Software
Page 19