


User’s Guide
Phase Analyzer
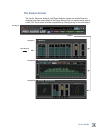
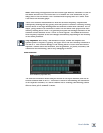
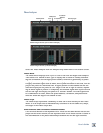
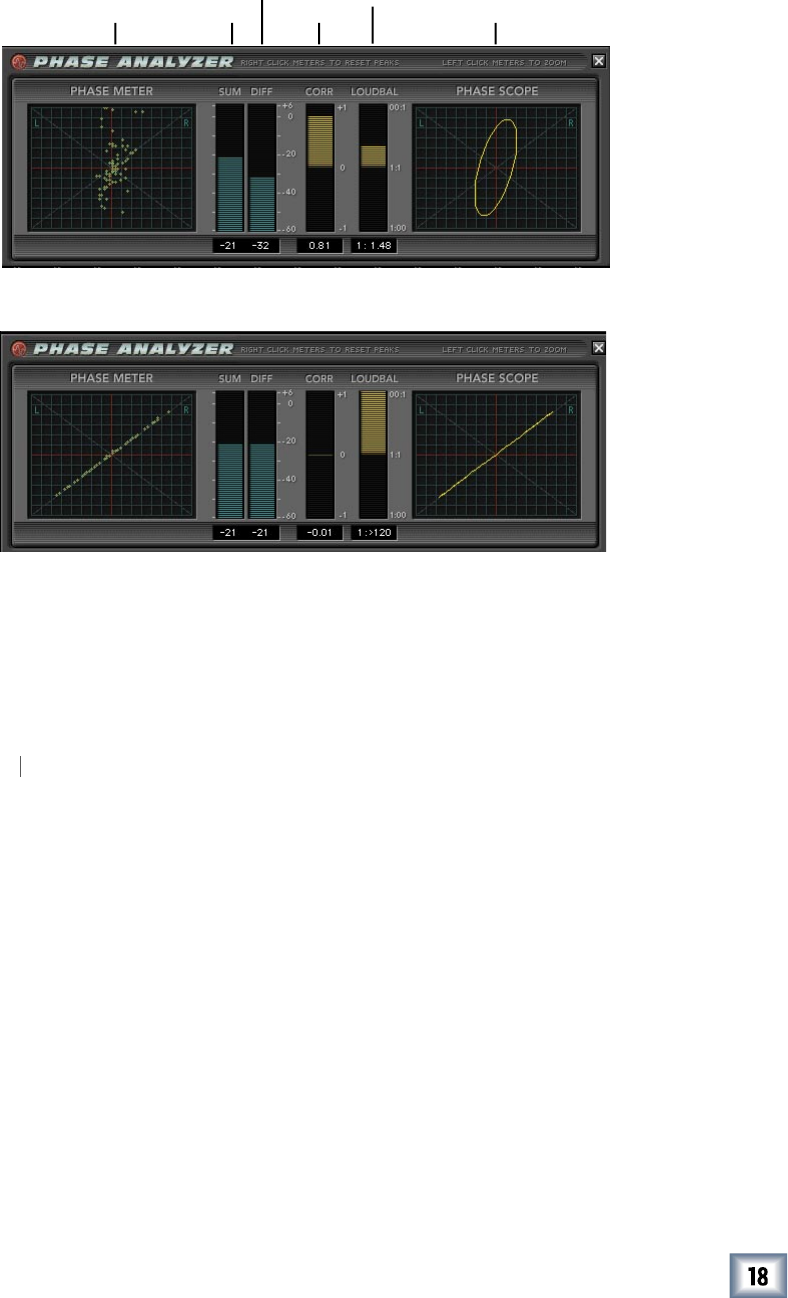
Phase Analyzer Screen (Out of Phase example)
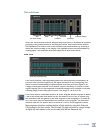
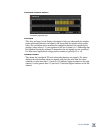
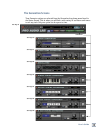
Phase Analyzer Screen (In Phase example)
Select the Phase Analyzer from the Analyzer drop-down menu of the Status Screen.
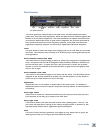
Phase Meter
The Phase Meter displays an X/Y plot of a set of raw Left and Right audio samples.
This results in a ‘swarm of bees’ type of display that is useful in visually determin-
ing the correlation and left/right power balance, referred to generically as phase.
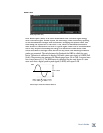
A highly
correlated signal such as mono will display all the points in a vertical line.
A highly
correlated signal such as mono will display all the points in a vertical line.
A highly
A highly correlated signal such as mono, with a phase inversion on one side, will dis-
play all the points in a horizontal line. A signal present on one channel and not the
other will display all the points at a 45° angle to the left or right of vertical, depend-
ing on which signal is present. A completely uncorrelated signal with equal levels on
the left and right will display the points in a ‘random’ fashion. All other signals will
be a combination of these, where the power balance, correlation, and phase deter-
mine the width and angle of the swarm of bees.
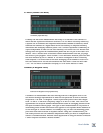
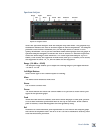
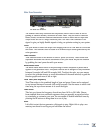
Phase Scope
The Phase Scope represents a summary of what can be seen visually on the Phase
Meter. It is an ellipse that is mathematically calculated to be the same size, shape,
and angle of the Phase Scope data.
Sum/Difference and Correlation/Loudness Balance
Click on these meters for an expanded view. These are the same meters that are dis-
played on the Levels Screen, but are duplicated here in the Phase section to assist in
the determination of the phase relationships between the left and right channels.
Phase Meter
Sum
Difference
Correlation
Loudness
Balance
Phase Scope