Soundscape Mixpander
Page 58 of 109
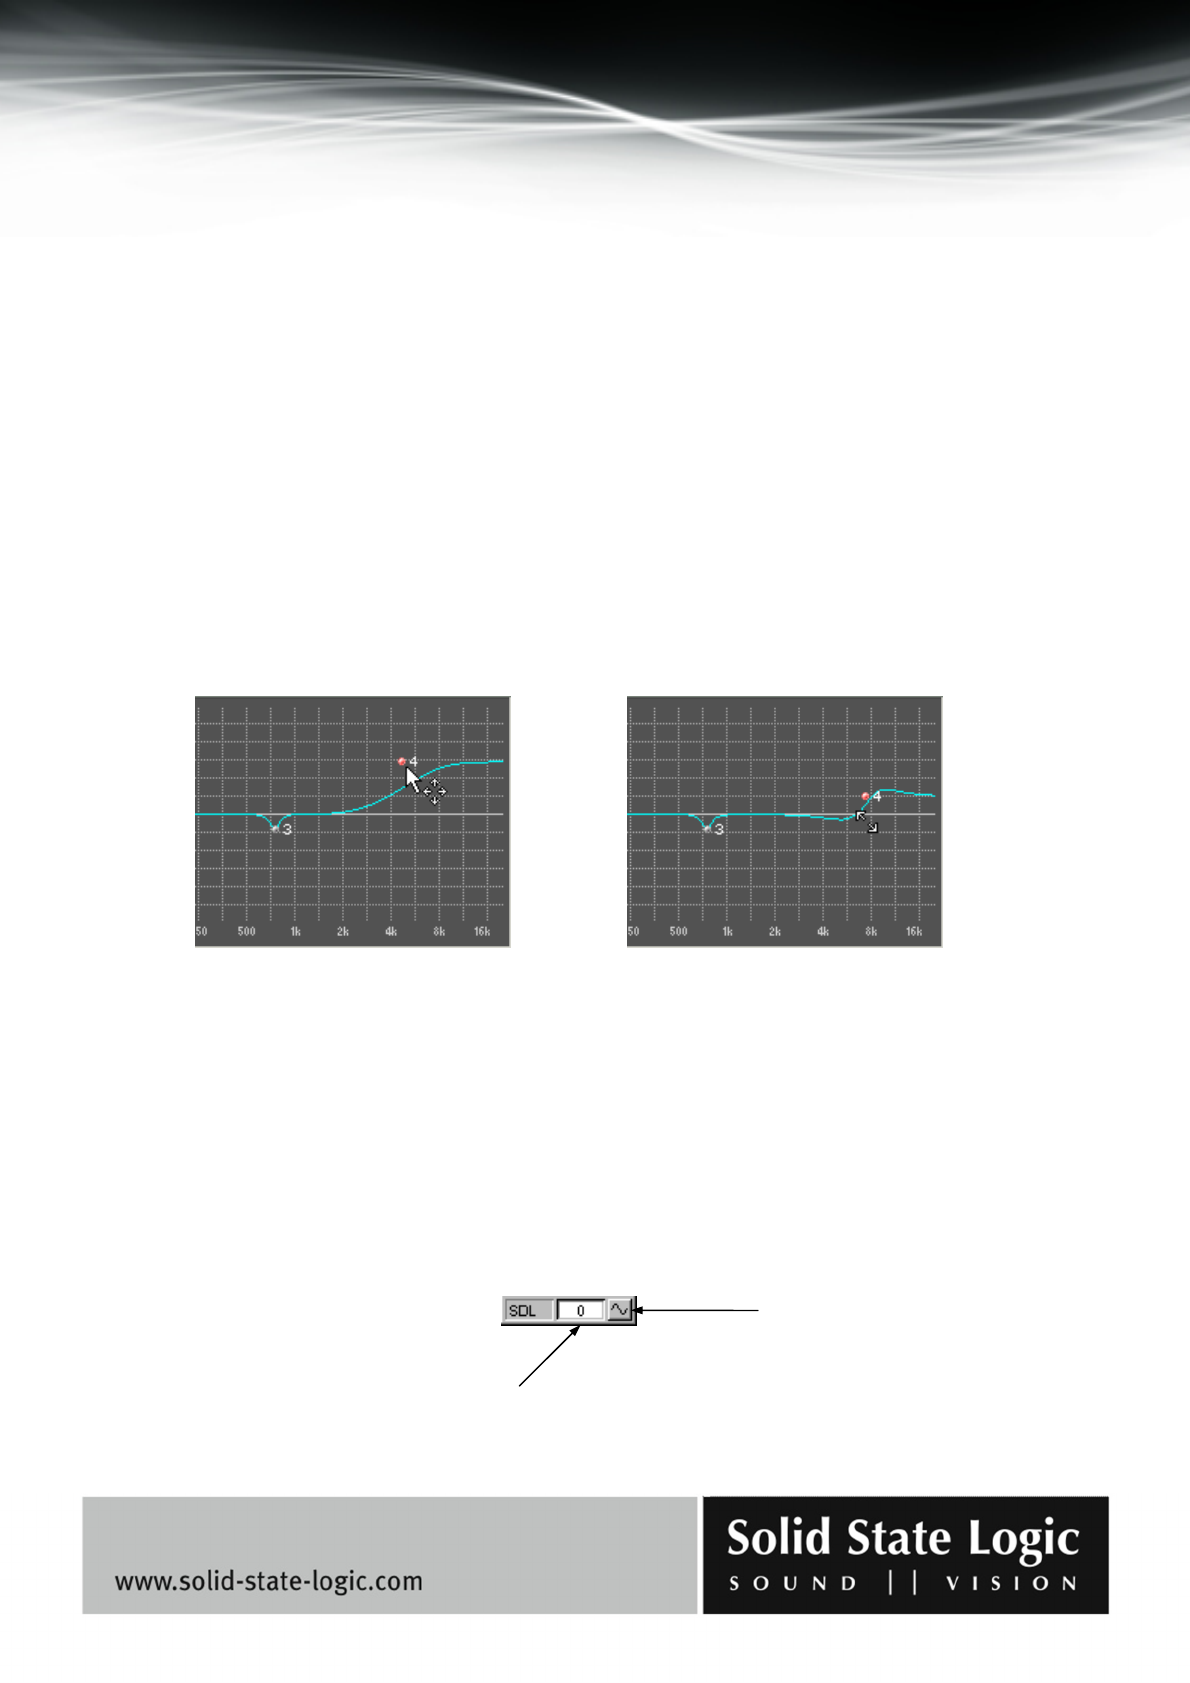
The EQ curve can also be edited directly in the curve display:
− The center frequency for each EQ band is represented in the curve display by a “node”. Each
node has a number, so that they can all be identified easily even if they have been moved around a
lot (any of the EQ bands can be set to any center frequency, so the node for EQ Band 1 could end
up being between the nodes for EQ bands 3 and 4). The nodes can be “clicked and dragged” with
the mouse. The frequency and gain parameters are adjusted accordingly in real-time.
− The curve itself can also be shaped by clicking and dragging, to increase or decrease the
bandwidth of an EQ band.
In either case (dragging the nodes or the line), the node for the EQ band being edited turns red to
help identification (this can be useful when the nodes and corresponding numbers are very close
to one another). The mouse pointer appearance also changes according to the edit which is being
carried out, as shown in the following examples:
Just below the title bar there is a field where the name of the current preset is displayed. To the left
of this name field there are load and save buttons which call up standard Windows open and save
dialog boxes. To the right there is a bypass button which can be used for easy A-B comparisons.
Sample delay line
The sample delay line element can be used to compensate for time delays generated in the mixer or
resulting from AD/DA conversion. It can also be used to invert the phase of a signal.
Dragging a node: Dragging the line:
Delay value (number of samples)
Phase inversion button
