


User’s Guide – version 3.1.3 NetFlow Tracker
21
Using NetFlow Tracker
Once you have installed NetFlow Tracker and configured your devices, data will be
available within a few minutes. There are many ways to access this data.
Real-time Data
NetFlow Tracker stores up to fourteen days full NetFlow data with one minute
resolution. This data can be reported upon once it is several minutes old. There are
several ways to view reports on this data – from the Network Overview
page, from the
Devices
page or from the Filter Editor.
Long-term Data
In addition to automatically storing full data for up to fourteen days, NetFlow Tracker
can be configured to store summarized data for any length of time. Long-term data is
not stored automatically; long-term reports must first be set up using the Report
Settings page. See the Long-term Reports chapter for more about setting up and
viewing long-term reports.
Executive Reports
You can configure custom reports using the Report Settings page that contain sections
from multiple real-time or long-term reports. See the Executive Reports
chapter for
more about setting up and viewing executive reports.
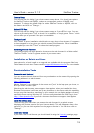
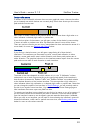
Network Overview
The Network Overview page is accessible from the home page of the software; if you
do not have user security set up (see Security Settings
) it is also the default page you
see when you access the software.
The page gives you a simple overview of the devices and interfaces currently carrying
the most traffic on your network. You can click on a device in the pie chart or on its
name to see its top applications and busiest interfaces; you can also click on an
interface name to see its recent traffic and top applications. It is also possible to
drilldown from any of the charts to examine the data in more detail; see Working with
Charts for more about this.
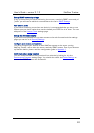
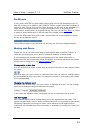
Devices
While the Network Overview page is useful for quickly identifying the busiest devices
and interfaces on your network, the Devices page lists all devices regardless of how
busy they are. You can sort the devices by name, address, recent peak traffic rate and
recent peak packet rate by clicking the appropriate column header. By default, each
peak rate is the highest two-minute rate in the last six hours, but this will be different if
the default time range is altered (see Report Settings
). Note that the report is
refreshed regularly to ensure it is always up-to-date.