


User’s Guide – version 3.1.3 NetFlow Tracker
30
•
VPNs – shows the VPNs with most traffic or packets. Interfaces must be
associated with VPNs in Device Settings
for this report to function.
• Next Hops – shows the next-hop addresses that received most traffic or packets.
Note that only a router can supply a next-hop address.
Traffic Identification Reports
• Identified Applications – shows the identified applications with most traffic or
packets. See Device Settings
for more information.
• Traffic Classes – shows the traffic classes that with most traffic or packets; see
Device Settings
for more.
Other Reports
• Total – shows just the total traffic and packets passing the filter.
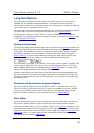
Creating Filtered Reports
NetFlow Tracker allows any chart or tabular report to be created using a powerful
dialog called the filter editor. To create a filtered report, click on “Filter Editor” on the
main page.
Most of the options in the filter editor are initially hidden to save space and bandwidth;
you can add a filter to the page by selecting it and clicking “Add”.
Each filter allows you to specify a restriction on the source data considered for the
report; if a filter is not specified it will not impose any restriction. You can choose to
include or exclude the items you select.
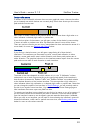
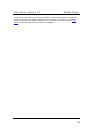
There are several ways to select items, depending on the type of the filter. Named
items can be selected by highlighting them in the left-hand “Available” box and using the
“>” button to move them to the right-hand “Selected” box. To deselect items highlight
them in the right-hand box and click “<”.
Some filters additionally allow you to manually enter an item in a box above the selected
box and click “Add”; to deselect an item added in this way click “<” as before. If a filter
does not have any named items there is a single selected box and a “Remove” button.
Some filters allow a range of items to be added; in this case enter the start and end of
the range in the boxes provided. To select a single item, leave the right-hand box
empty,
If you are logged in as an administrator or not logged in you can save a filter by clicking
“Save…” at the bottom of the page. This allows you to assign a name to a set of filters
for re-use later. If you have any saved filters defined they are available in the same
dropdown list used to add filters to the page. Saved Filters are managed in Report
Settings.
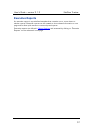
Report Template
You can choose the type of element you wish to report here, and specify whether you
want to create a tabular report, chart or pie chart. For more about the different types
of report, see Report Templates
above.