


User’s Guide – version 3.1.3 NetFlow Tracker
23
Per-AS data
If your router uses BGP to route traffic it will provide source and destination origin or
peer AS numbers in its NetFlow data. NetFlow Tracker creates optimised bi-directional
charts for each AS just as it does for each interface. An AS chart is only available for a
single device as otherwise there is a high chance that some or all traffic will be
accounted for multiple times by multiple routers. You can use the Filter Editor
to create
a report or chart based upon an AS and data from multiple routers.
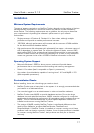
To view the ASs routed by a given router, click the ASs link in the navigation menu at
the top of the interface report:
The AS list is similar to the interfaces list, but does not show percentage utilization.
Working with Charts
Charts are one of the most useful ways of working with data in NetFlow Tracker. A
chart lets you quickly pick out an area of interest to examine in further detail.
A chart displays the elements that contributed most to the overall total traffic or
packet rate over the charted time range. By default, at most ten elements are charted
but this can be configured in the Report Settings
page.
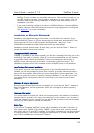
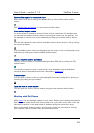
Viewing earlier or later data
You can easily look at earlier or later data by using the forward and back buttons above
the chart:
Note that when you open a device or interface chart from the device or interface lists it
will automatically to keep up to date, but using the forward or back buttons will prevent
this from happening.
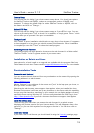
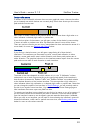
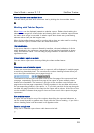
Changing the displayed chart
All charts have several views, only one of which is displayed at a time. You can change
which one is displayed using the tabs above the chart:
In this case, the utilization chart is displayed and the corresponding tab is raised.
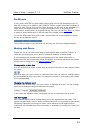
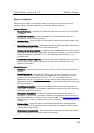
The chart legend
Each charted element has a corresponding row in the legend below the chart. The
legend may also have a row for other elements that were not big enough to be charted
separately. Depending on the type of chart, some elements in the legend may be
underlined; this indicates that more information is available by hovering the mouse over
the text.