


User’s Guide – version 3.1.3 NetFlow Tracker
82
Appendix 2: CSV File Format
Every standard chart and tabular report can be converted to comma-separated-value
format for importing into a database server or spreadsheet.
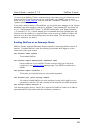
Chart CSV format
Each section is separated by a row of “=” signs. The first section is the chart title; the
second is the time range and filter.
Each subsequent section represents a single chart, equivalent to the tabs above the
chart in an interactive chart. If a utilization chart is present it will be included in the
CSV file but with identical data to the traffic rate chart. The first line of the section is
the name of the chart. The next two rows contain the start and end time of each
sample in milliseconds UTC. Each has an empty column at the start to accommodate
the description of each data row below. Each data row consists of a description
followed by an octet or packet count for each sample.
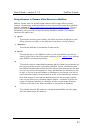
Tabular report CSV format
Each section is separated by a row of “=” signs. The first section is the report title; the
second is the time range and filter.
The third section starts with the title of each column, separated by a comma. Each
subsequent line in the section is a row with each value separated by a comma, and
text values contained within double quotes. There are several differences between a
report viewed in a browser and one converted to CSV; in CSV format all rows are
included, information normally available by hovering the mouse over a label is
unavailable, and traffic and packets passed are output as simple counts rather than
rates.
The fourth section contains column totals, again separated by commas. There will
usually be empty values in the total row corresponding to non-numeric columns.