


User’s Guide – version 3.1.3 NetFlow Tracker
26
V
iew a pie chart as a standard chart
You can view a pie chart as a chart over time by clicking the chart toolbar button:
Working with Tabular Reports
Most charts can be displayed instead as a tabular report. Rather than breaking the
selected time range into small chunks and charting each one, a tabular report shows
the entire time range in one table. A tabular report also shows every contributing
element rather than just the largest ones.
Many of the toolbar buttons used for working with a chart are also used for working
with a tabular report; however there are some differences.
Filtered utilization
If the source data for a report is filtered by interface, the total utilization of all the
traffic displayed in the report as a percentage of the interface bandwidth is shown
under the interface name. This can help you judge whether an element’s traffic is
significant or not.
View a tabular report as a chart
You can view a report as a chart by clicking the chart toolbar button:
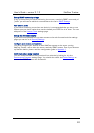
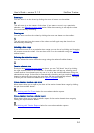
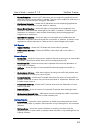
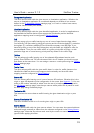
View more rows of a tabular report
If there are more than twenty-five rows in a report it will be displayed in multiple pages
to avoid long download times. The row above the column headings shows where you
are in the report and allows you to page through it:
The buttons to the left of the scrollbar move to the first page of the report and back
one page, respectively. Since the first page of the report is shown already, these
buttons are unavailable. The buttons to the right of the scrollbar move forward one
page and to the last page respectively. Clicking anywhere in the scrollbar will move to
the corresponding position in the report; i.e., if you click one-third of the way along the
scrollbar the page one-third of the way into the report will be shown. A blue line or box
on the scrollbar indicates what page is shown and how much of the report the page
represents.
Sort a tabular report
A report can be sorted on any of the columns describing the reported elements, or
can be sorted by traffic or packet rate. Simply click the column heading – if you click a
column heading twice it will be sorted in the opposite order.
Examine a single row
Every row in a tabular report has a radio button to its left: