


User’s Guide – version 3.1.3 NetFlow Tracker
35
Long-term Reports
Long-term reports allow you to look at data over much longer time ranges than is
possible with the standard real-time database. The data for long-term reports is
s
ummarized in advance so a long-term report over several days or weeks can often be
much faster than an equivalent real-rime one.
Long-term reports are not created automatically – you must first identify which reports
you would like to see over the long-term and set them up in Report Settings
.
To access your long-term reports, click on “Long-term Reports” on the software’s
homepage. You can then access your long-term reports in two ways: the Devices
page
or the Long-term Filter Editor
.
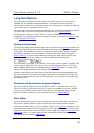
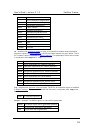
Devices and Interfaces
The long-term device and interface pages are very similar to the real-time versions, but
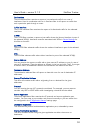
there are several differences. Most noticeable is the time range selector at the bottom
of the page. The default time range for a long-term report is the last seven full days
according to the time zone of the NetFlow Tracker server; this can be changed in
Report Settings
. The time range selector will change the time range of the current
report or chart, and of any reports or charts opened by interacting with it:
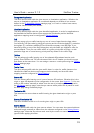
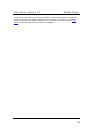
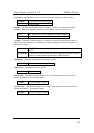
You can select any number of full minutes, hours, days, weeks, months, quarters, half-
years or years. Note that if you zoom in to or out of a long-term chart, or drill down
into a selection (other than one selected using the Select All
button), the time range
selector will not be available on the resulting chart.
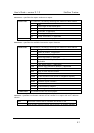
Another major difference is that while the real-time device and interface pages show
the peak and most recent traffic and packet rates over the displayed time range, the
long-term versions show the peak and average rates. You can also sort the pages by
the average rates.
Per-device and Per-interface Long-term Reports
When you select a range of time on a long-term device or interface chart and right-
click to drill down you will either find that no charts are available or the set is limited.
The only reports that you can access in this way are ones that are created as per-
device, per-inbound interface or per-outbound interface in Report Settings
.
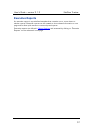
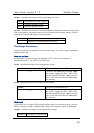
Filter Editor
You can access any long-term report through the long-term filter editor. It is the only
way you can access custom long-term reports that are created as basic reports.
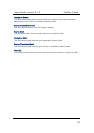
The long-term filter editor is a much simplified version of its real-time
counterpart. You
must select the report and time range to view. If the report did not have a time mask
applied to it when it was created you will be able to apply one using the Time Mask
and
Time Zone
editors. The time range and time mask editors behave exactly like their
counterparts in the real-time Filter Editor
.