


28
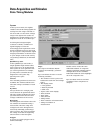
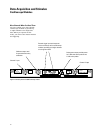
Data Acquisition and Stimulus
State/Timing Modules
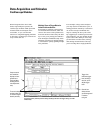
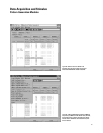
Eye scan
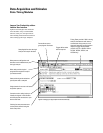
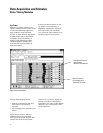
In the eye scan mode, the Agilent
16760A scans all incoming signals for
activity in a time range centered on
the clock and over the entire voltage
range of the signal. The results are
displayed in a graph similar to an eye
diagram as seen on an oscilloscope.
As timing and voltage margins
continue to shrink, confidence in
signal integrity becomes an
increasingly vital requirement of the
design verification process. Eye scan
lets you acquire comprehensive signal
integrity information on all the buses
in your design, under a wide variety
of operating conditions, in minimum
time.
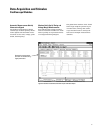
Qualified eye scan
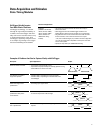
In the qualified eye scan mode, a
single qualifier input defines what
clock cycles are to be acquired and
what cycles are to be ignored in the
eye scan acquisition. For example,
you may wish to examine the eye
diagram for read cycles only,
ignoring write cycles.
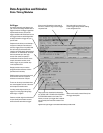
Cursors
Two manually positioned cursors are
available. The readout indicates the
time and voltage coordinates of each
cursor.
Eye limit
The eye limit tool is a single point
cursor that can be positioned manu-
ally. The readout indicates the inner
eye limits detected at the time and
voltage coordinates of the cursor.
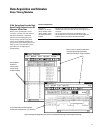
Histogram
The histogram tool indicates the rela-
tive number of transitions along a
selected line. The time range and
voltage levels of the histogram are
selected by manually positioning a
pair of cursors. The cursors indicate
the voltage level and the beginning
and end times of the histogram.
Polygon
A 4-point or 6-point polygon can be
defined manually.
Slope
The slope tool indicates DV/DT
between two manually - positions
cursors.
Eye scan allows the user to set the
following variables:
• The number of clock cycles to be
evaluated at each time and voltage
region
• The display mode
• Color graded
• Intensity shaded
• Solid color
• Aspect ratio of the display
• Time/division
• Time offset
• Volts/division
• Voltage offset
• Time resolution of measurement
• Voltage resolution of
measurement
Results can be viewed for each
individual channel. A composite
display of multiple channels and/or
multiple labels is also available.
Individual channels can be highlight-
ed in the composite view
Eye scan data can be stored and
recalled for later comparison or
analysis.