


45
Post-Processing and Analysis Tool Sets
Data Communications
Monitor Packet Information on
Parallel Data Buses
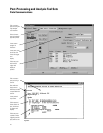
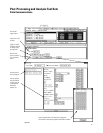
The data communications tool set
shows parallel bus data at a protocol
level on the logic analyzer. Developers
have the capability to find complex,
system-level bus interaction problems
in applications such as a switching or
routing system.
Obtain Answers to the Following
Questions:
• What is the time difference
between two or more data paths
and/or a microprocessor?
• Did a packet make it through the
switch or router?
• Why did a packet take so long to
go through the switch or router?
• Where did an illegal packet come
from?
• What is the latency on packet
information?
• What is corrupting packets?
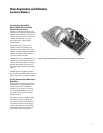
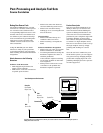
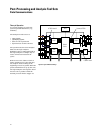
Product Description
The Agilent Technologies B4640B
data communications tool set adds
protocol analysis capabilities to the
logic analyzer for viewing parallel
data buses (e.g, UTOPIA or a propri-
etary data bus) in a switching or
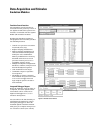
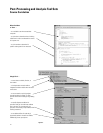
routing system. Each protocol layer is
displayed with a different color in the
logic analyzer lister display to allow
easy viewing of the protocol data.
Payload information is included after
the header in a raw hex format.
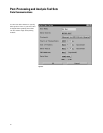
Filters are included to allow many
different views of the data. Protocol
layers can be collapsed or expanded
to create a custom view of the data
acquired in the logic analyzer. With
the filters, you can concentrate on
the data of interest for a particular
measurement.
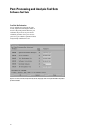
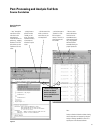
The powerful protocol trigger macro
allows easy trigger setup by eliminat-
ing the need to manually configure
the trigger sequencer for complex
measurements. All custom-defined
protocol fields or layers are support-
ed in the trigger macro.
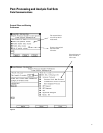
All packets or cells are time-stamped
in the logic analyzer for time-correla-
tion measurements with other system
buses, such as a microprocessor,
memory interface, PCI bus, or other
UTOPIA bus. All state listing and
waveform displays in the logic ana-
lyzer are time-correlated with global
markers for a complete view of the
system. With this tool, it is possible
to trigger the logic analyzer with a
microprocessor event and see what is
happening on a parallel data bus with
protocol information.
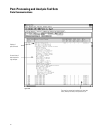
By monitoring multiple time-correlat-
ed data buses, you can monitor a
packet entering one ASIC and see
how long it takes for the packet to
reach another part of the system. The
powerful trigger can also monitor a
packet entering one port and trigger
if the packet has not reached another
port by a designated time.