


40
Standard programs
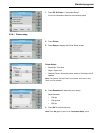
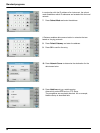
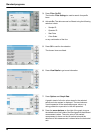
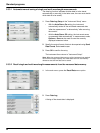
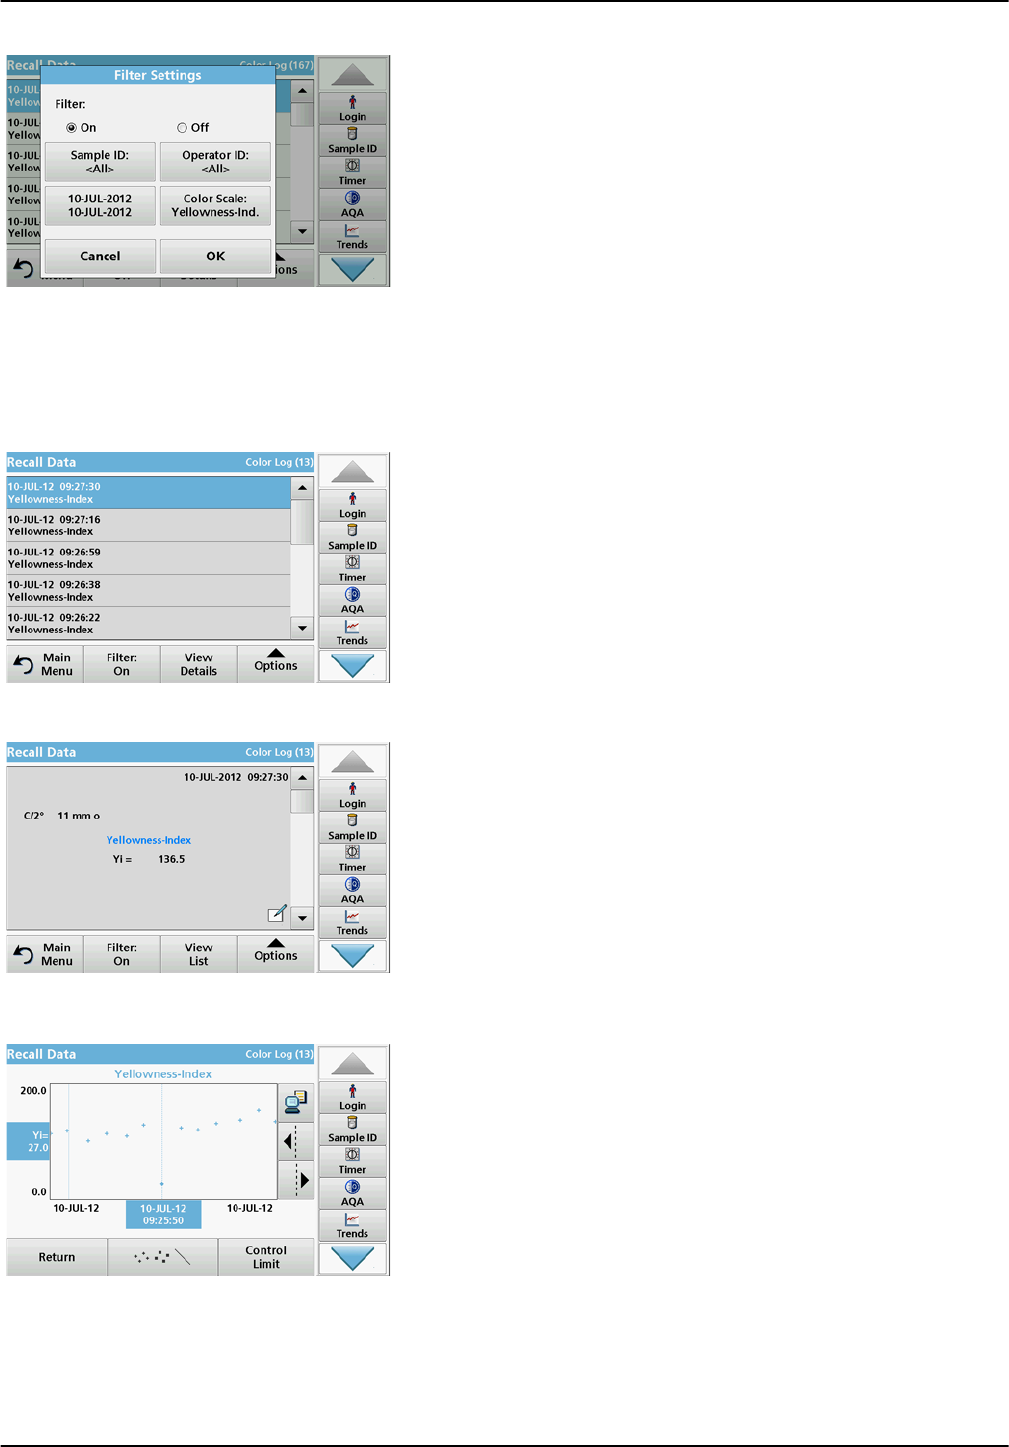
3. Press Filter: On/Off.
The function Filter Settings is used to search for specific
items.
4. Activate On. The data can now be filtered using the following
selection criteria.
• Sample ID
• Operator ID
• Start Date
• Color Scale
or any combination of the four.
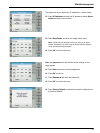
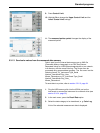
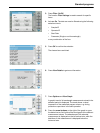
5. Press OK to confirm the selection.
The chosen items are listed.
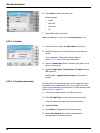
6. Press View Details to get more information.
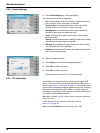
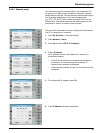
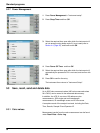
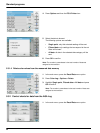
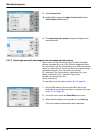
7. Press Options and Graph Data.
A graphic trend of all color values stored in the selected
period and color system is displayed. The trend shows a
visual impression of the measured process values, e.g.
during production supervision in the shift operation.
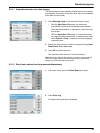
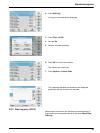
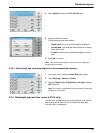
8. Press the arrow buttons on the right of the graph to move
the dotted cursor line inside of the trend graph to the different
measurement values. The color value of the marked
measurement is shown on the left vertical axis and the
date/time of this measurement is shown below the horizontal
axis.