


84
Standard programs
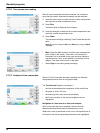
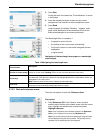
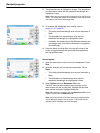
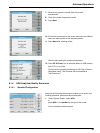
2. The reference curve is displayed in orange. The absorbance
or transmittance value and the associated wavelength are
highlighted in grey.
Note: A black and an orange field are displayed in the top left of the
screen. The orange box relates to the reference scan and the black
one relates to the current wavelength scan.
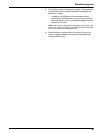
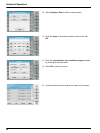
3. To complete the wavelength scan reading, refer to
section 5.7.4.2, page 82.
• The newly plotted wavelength scan curves are shown in
black.
• The absorbance or transmittance value and the
associated wavelength are highlighted in black.
• In addition, the display shows the difference between the
wavelength scan curve and the reference curve against
the wavelength.
4. Press the black or orange field in the top left corner of the
screen to toggle between the measured wavelength scan
and the reference scan
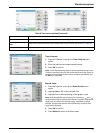
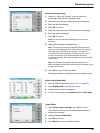
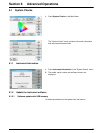
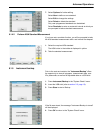
Second option:
1. Insert the zero solution cell into the cell compartment. Press
Zero.
2. Insert the analysis cell into the cell compartment. Tap on
Read.
• The newly plotted wavelength scan curves are shown in
black.
• The absorbance or transmittance value and the
associated wavelength are highlighted in black.
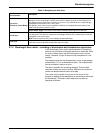
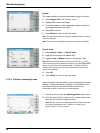
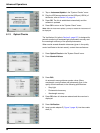
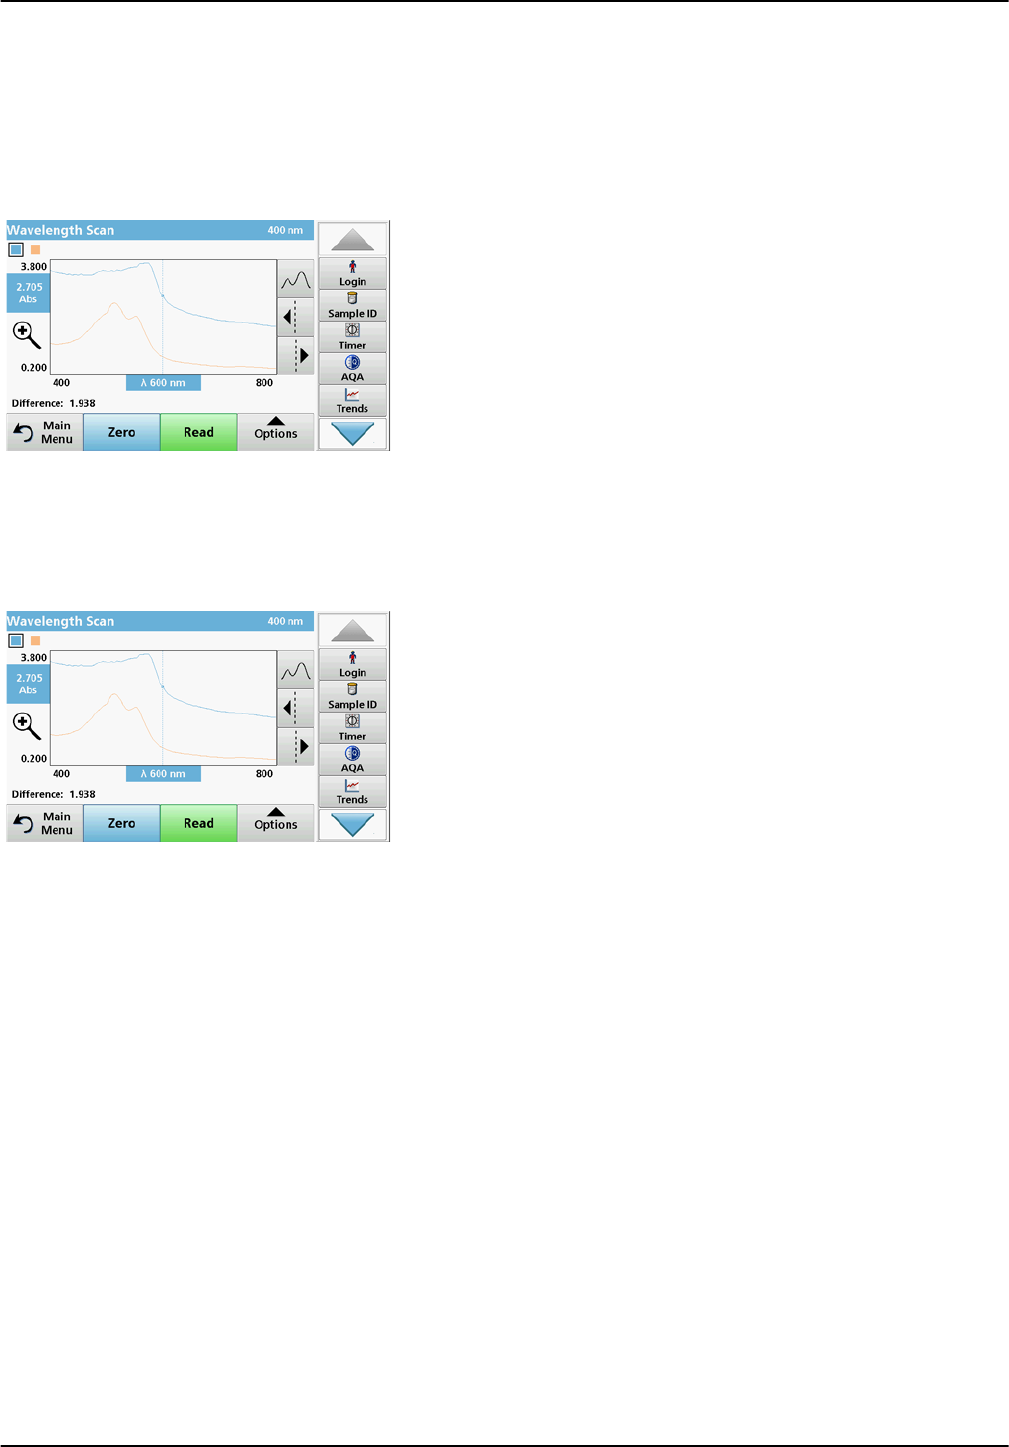
3. Press Options and then Reference: Off in the
"Options" menu to select another scan to display on the
same screen with the current scan. Highlight the required
scan number and press Highlight Reference.
Note: After selecting a reference scan the Reference: Off key in the
"Options" menu turns into Reference: On.
Note: Only scans that have the same wavelength range and step
can be displayed using the overlay option. This process can be
repeated until all matching scans are displayed.