


83
Standard programs
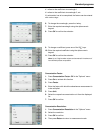
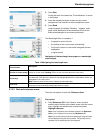
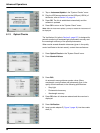
3. Press Zero.
During the scan of the base line, "Zero calibration" is shown
in the screen.
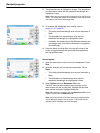
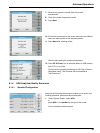
4. Insert the prepared analysis cuvette into the cuvette
compartment and close the cuvette compartment cover.
5. Press Read.
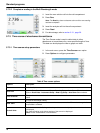
Under the graph, the display "Reading..." appears, and a
graph of the absorbance or transmittance values for the
scanned wavelengths is continuously displayed.
The Wavelength Scan is complete, if
• the graph is shown full-size,
• the scaling of the x-axis occurs automatically,
• the Cursor functions in the vertical navigation bar are
highlighted.
• a signal sounds
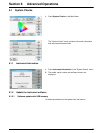
Navigation of the wavelength scan graph or a wavelength
scan analysis
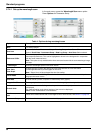
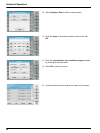
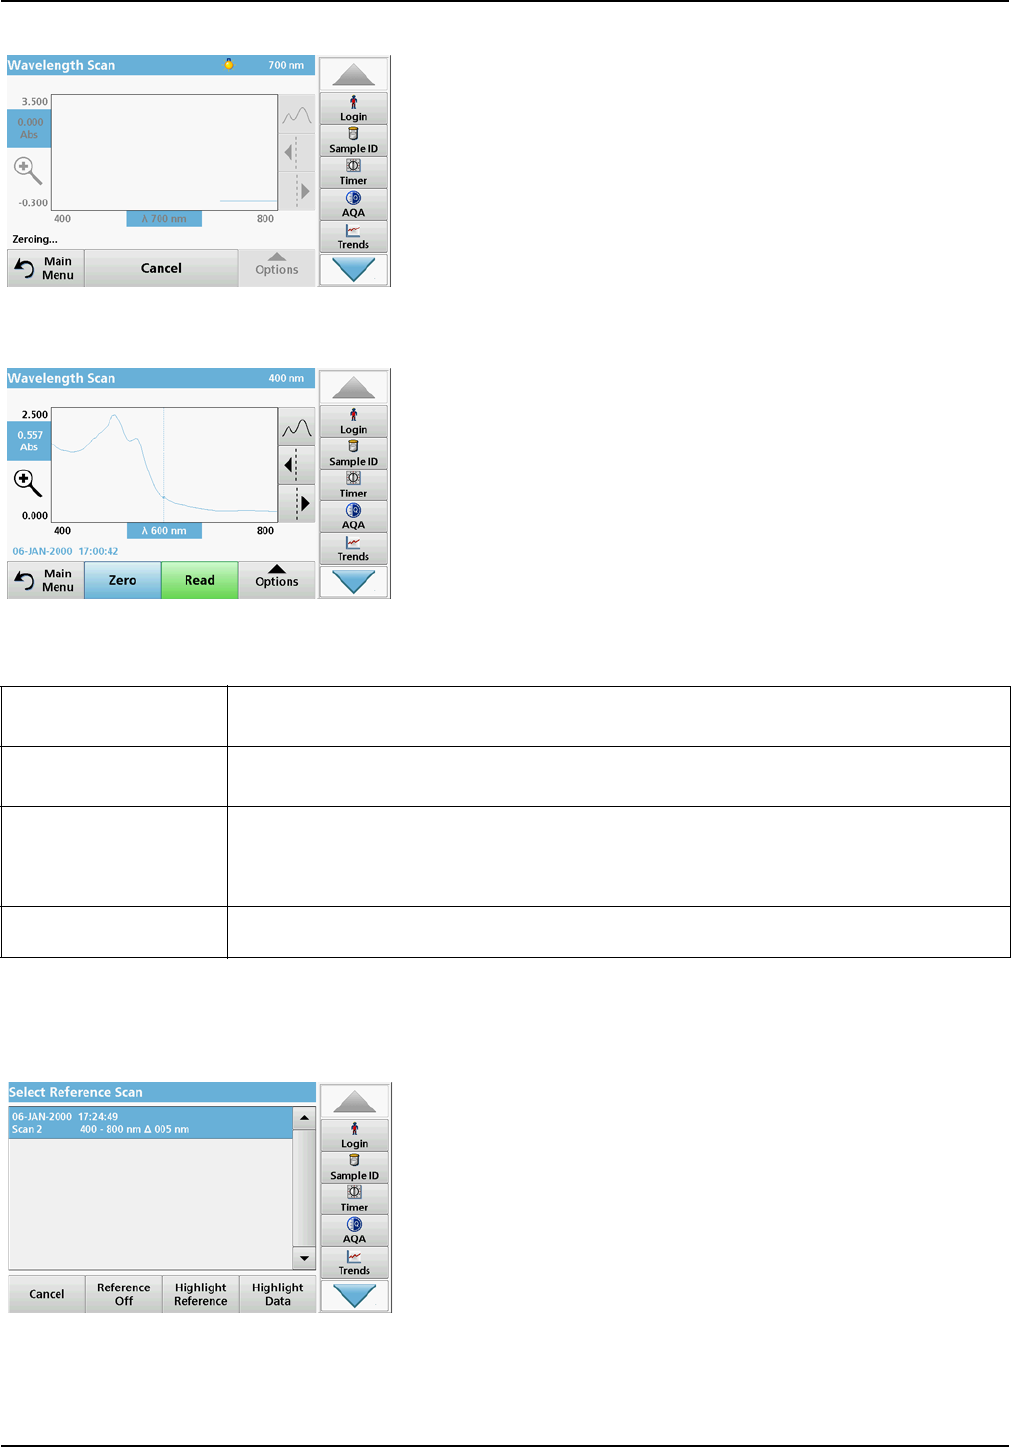
5.7.4.3 Work with reference scans
There are two options to work with Reference Scan:
First option:
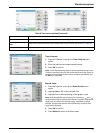
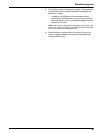
1. Press Reference: Off in the "Options" menu to select
another scan to display on the same screen with the current
scan. Highlight the required scan number and press
Highlight reference.
Note: Once a reference scan has been selected, the Reference:
Off key in the "Options" menu turns into Reference: On.
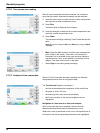
Note: Only scans that have the same wavelength range and step
can be displayed using the overlay option. This process can be
repeated until all matching scans are displayed.
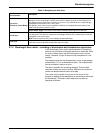
Table 12 Navigating the wavelength scan
Cursor function/
Zoom function
Description
Curve Icon
(Choice of Cursor mode)
Choice of Cursor mode Peak/Valley (cursor moves between minimum/maximum absorbance
values) or Cursor mode Tracking (cursor moves over each data point of the scan).
Arrow keys
The arrow keys (right/left) are used to move the cursor (depending on the selected mode) to the
next data point. The data of the data point (wavelength/absorbance or transmittance value) are
highlighted on the x and y axes.
Note: Press any point on the curve to display the associated data.
Zoom Icon
This function is used to magnify the section of the curve in the vicinity of the cursor. The original
curve size can be restored by pressing the zoom icon again.