


62
Standard programs
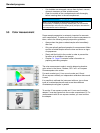
The CIE L*a*b* values depend on the path length of the
cuvette/sample cell. Therefore the scale of the a*, b* axis in the
graph depends also on the cuvette/sample cell size.
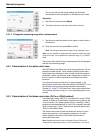
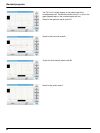
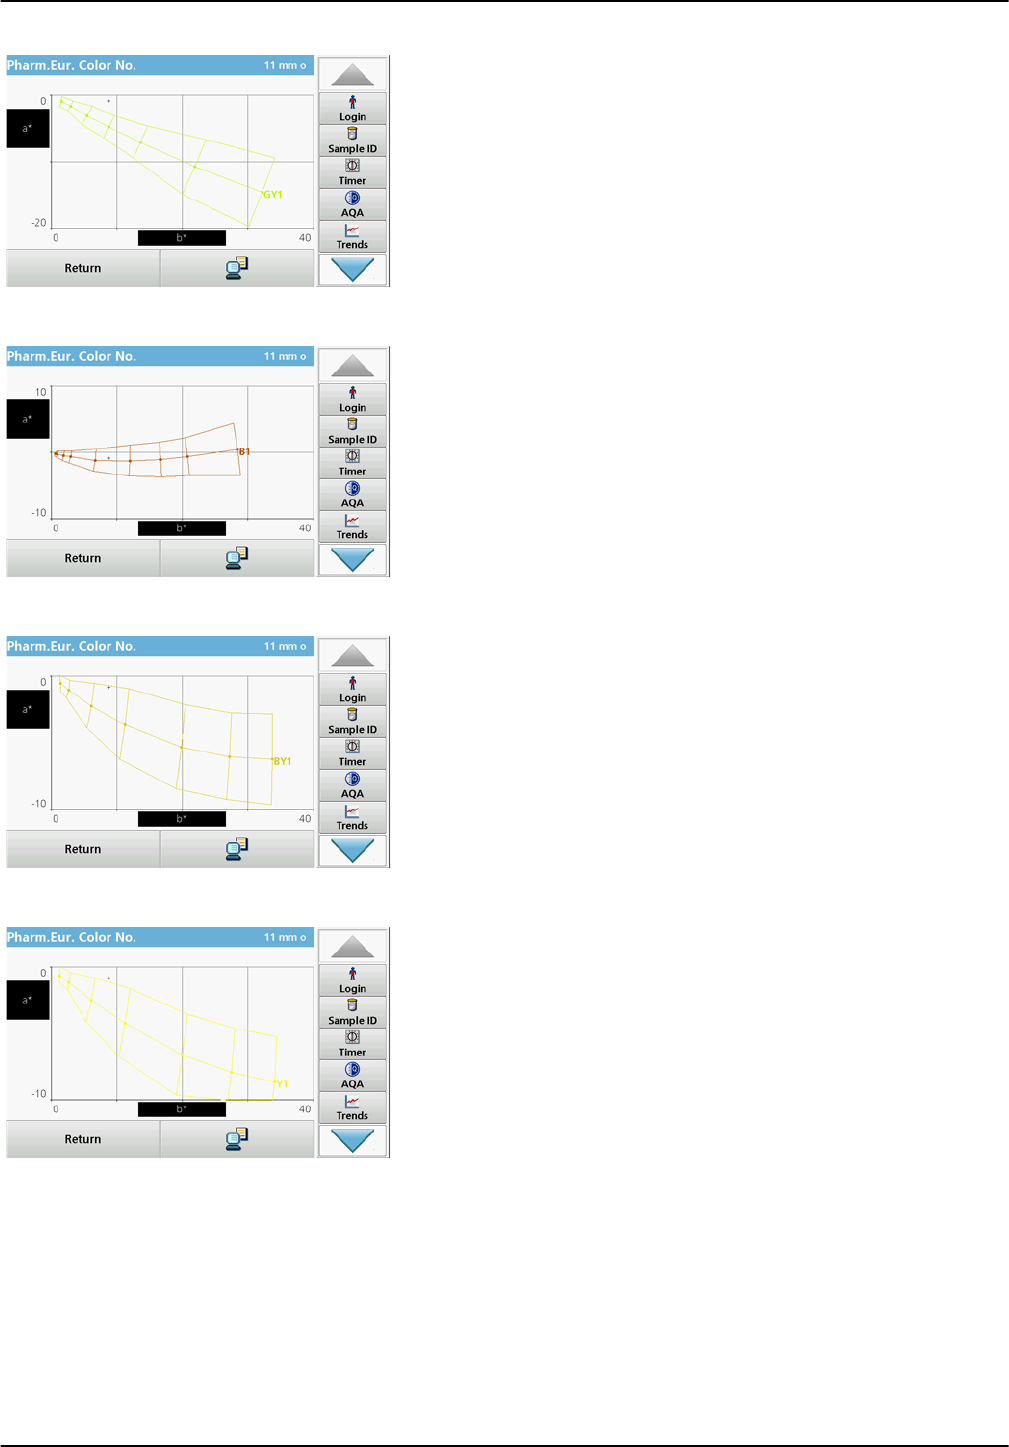
Graph for the greenish yellow scale GY.
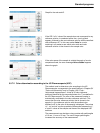
Graph for the brownish scale B.
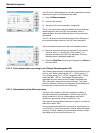
Graph for the brownish yellow scale BY.
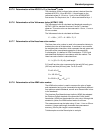
Graph for the yellow scale Y.