


61
Standard programs
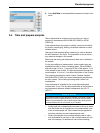
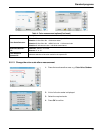
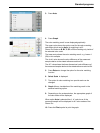
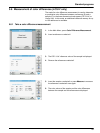
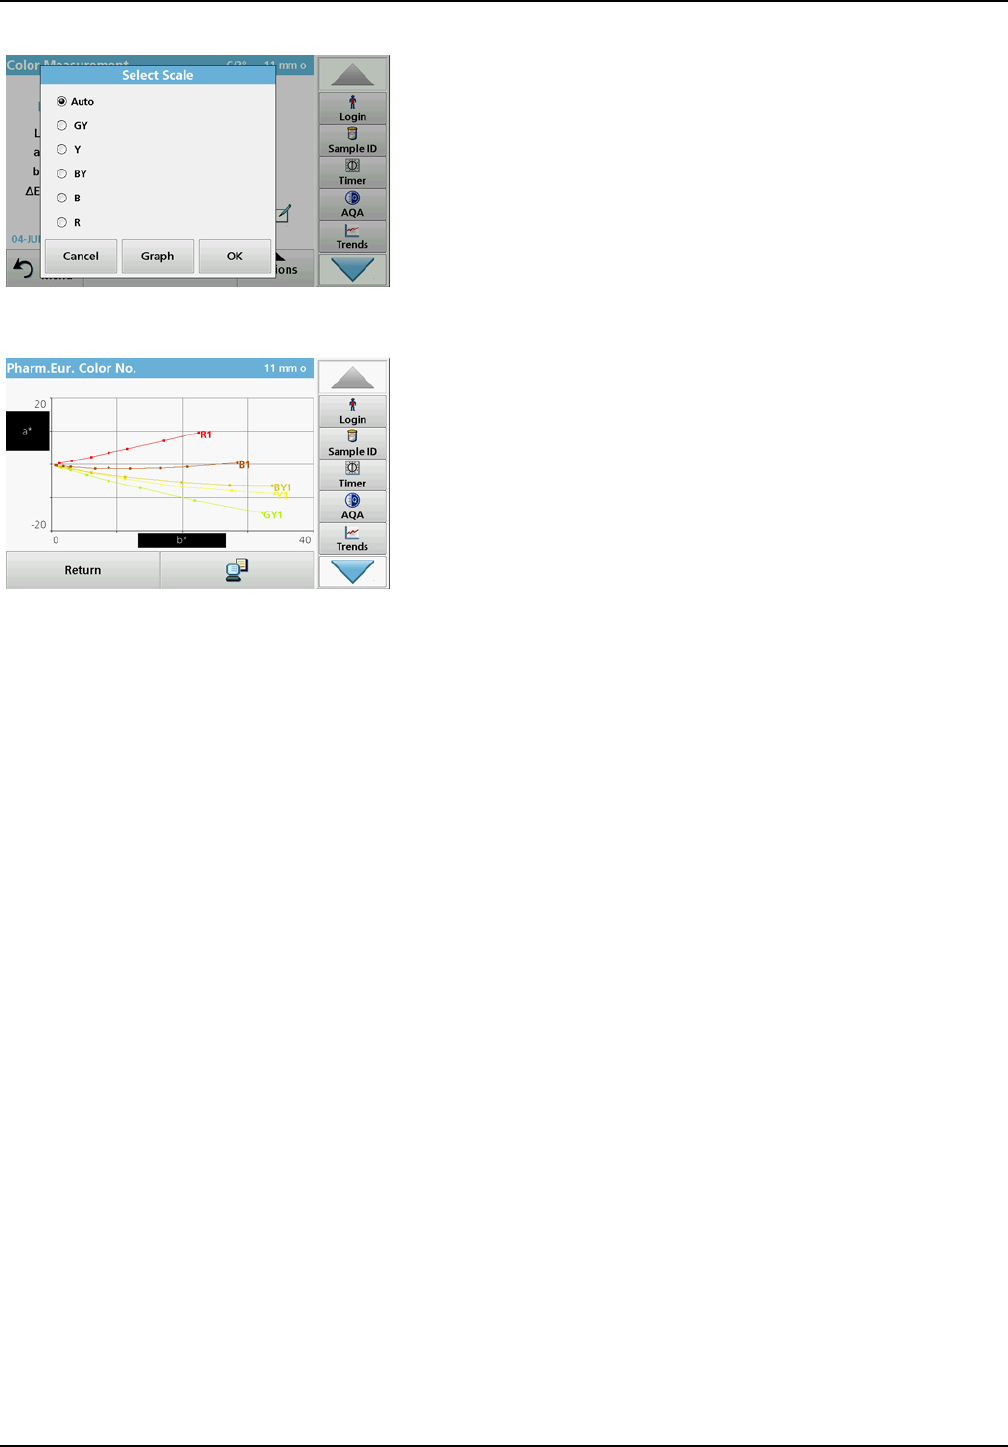
3. Press Auto.
4. Press Graph.
The color matching result is now displayed graphically.
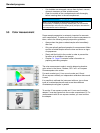
The upper value shows the option used for the color matching
calculation which can be Auto for matching in all 5
Pharm.Eur.Scales or B, BY, Y, GY or R for matching only inside of
the selected color scale.
The lower entry shows the color matching result, e. g. brown 4
(B4) in this example.
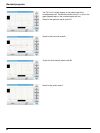
The Lab* value shows the color difference of the measured
sample relative to the stated reference solution B4.
The E* value shows the three-dimensional color difference of
the measured sample relative to the stated reference solution B4.
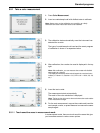
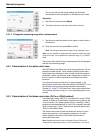
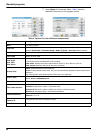
5. Press Return to change the option for the color matching
function.
6. Select Scale is displayed.
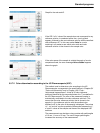
7. The option for color matching to a special scale can be
changed.
8. Graph offers a visualisation of the matching result in the
selected matching option.
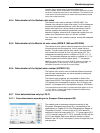
9. Depending on the scale selection, the appropriate graph of
the color scale will be displayed.
When option Auto is selected the a*, b* color locus of the
measured sample will be displayed in all 5 color scales of the
Pharm Eur.
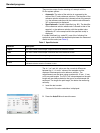
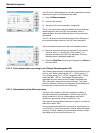
10. Press the Print symbol to print the graph.