56
Standard programs
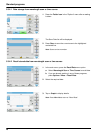
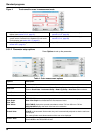
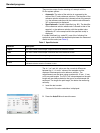
Figure 4 Touch-sensitive areas in measurement mode
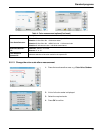
5.5.1.2 Parameter setup options
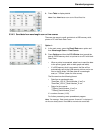
Press Options to set up the parameter.
1 Open Select Color Scale, and select the scale for the
display (see section 5.5.1.3, page 57).
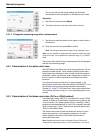
4 Change the Upper Limit of the color range (see
section 5.5.1.4, page 58).
2 Change the displayed color scale to the next color
system which is selected in the Operator ID color scale
list for display (see section 5.5.1.3, page 57).
5 Change the Lower Limit of the color range (see
section 5.5.1.4, page 58).
3 OpenSample ID to change or add the sample ID (see
section 5.2.2, page 24).
6 Open Comments to enter a comment.
Table 4 Color measurement options
Options Description
More For further Options
Save icon
Symbol: Store Data, if Instrument Setup > Data Log Setup > Auto Store: Off is selected.
Symbol: Recall Data, if Instrument Setup > Data Log Setup > Auto Store: On is selected.
Send Data icon To send data to a printer, computer or USB memory stick (USB A) or network.
Color Scale Select the color scale
View Graph
View Table
View Values
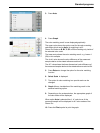
VIEW GRAPH shows the spectral graph of the transmittance or absorbance graph.
Note: View Graph is activated after the first measured value.
VIEW TABLE displays the spectral transmittance values T% from 380 nm to 720 nm.
VIEW VALUESdisplays the result of the last color calculation.
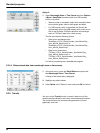
Scale & Units
UNITS: Select absorbance or transmittance.
SCALE: In the automatic Scale mode, the y-axis is automatically adjusted so that the total scan
is displayed.
The manual Scale mode allows sections of the scan to be displayed.
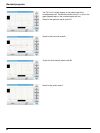
Ph.Eur.: Auto
European Pharmacopoeia
Select AUTO or the REQUIRED SCALE


