


63
Standard programs
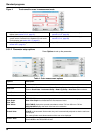
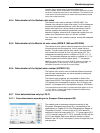
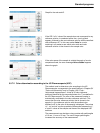
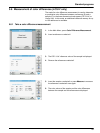
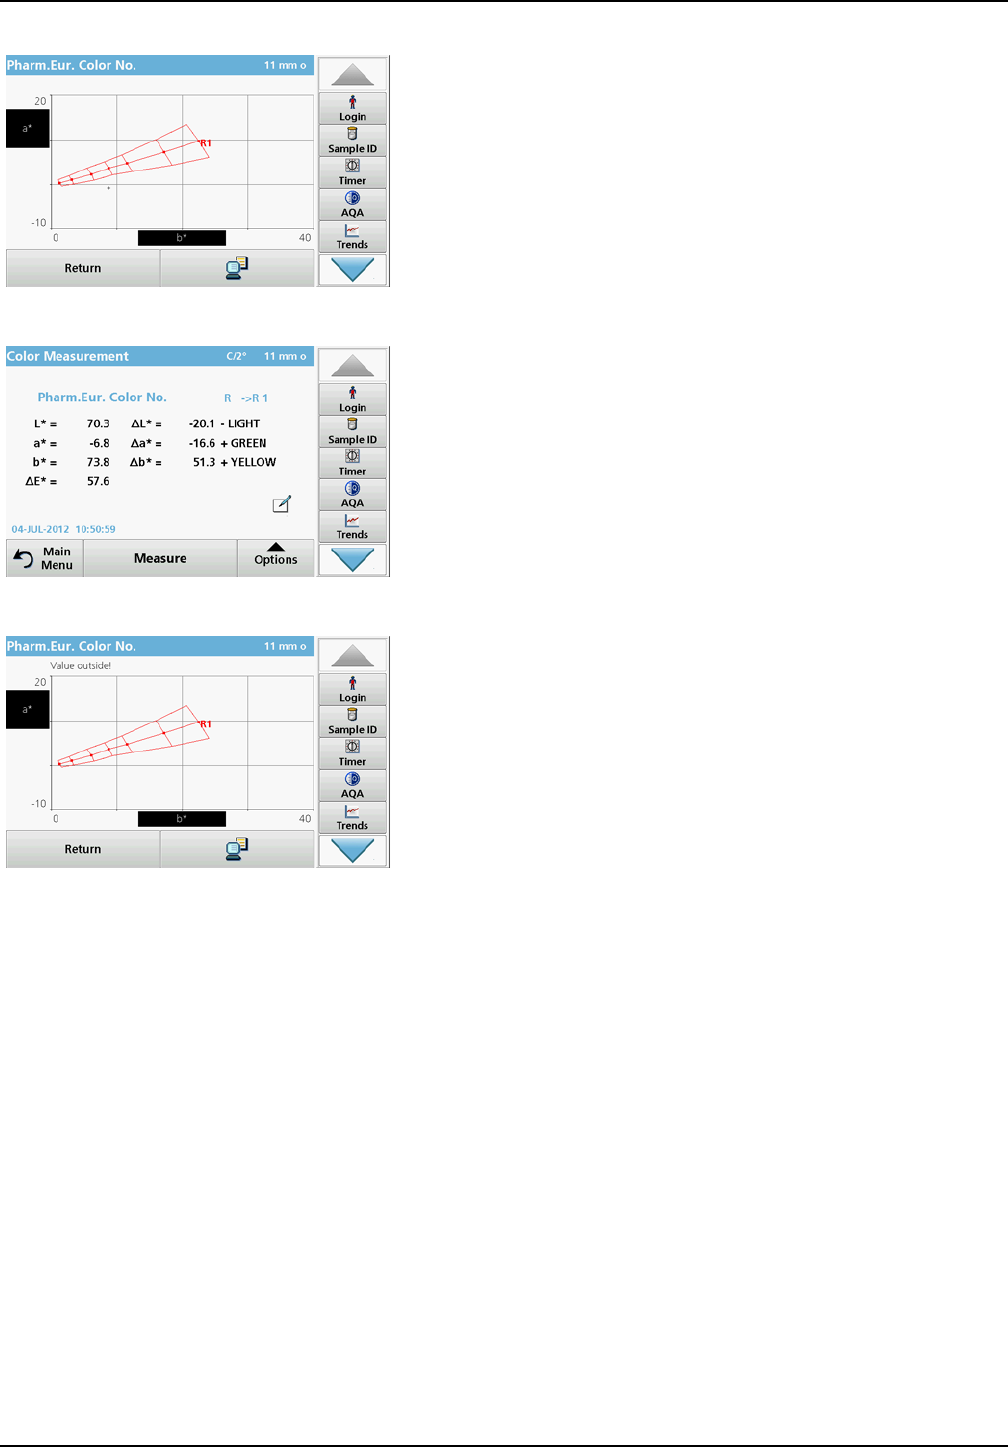
Graph for the red scale R.
If the CIE L*a*b* value of the sample does not correspond to any
reference solution in a selected scale, the > (next) symbol
appears, followed by the next reference solution with the smallest
color difference E*. In this case, select Auto for a color
matching in all scales to see which color scale and color
reference solution is the closest to the sample color.
If the color space of the sample is outside the graph of a color
comparison scale, the error message Value outside! appears
above the graph.
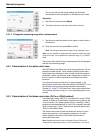
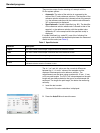
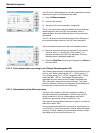
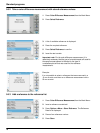
5.5.7.2 Color determination according to the US Pharmacopoeia (USP)
The method used to determine color according to the US
Pharmacopoeia corresponds to the specifications in Chapter 631
"Color and Achromicity" and in Chapter 1061 "Color -
Instrumental measurement". A total of 20 color reference
solutions (identified by the sequential letters A to T) are defined in
the US Pharmacopeia. The color of the measured sample is
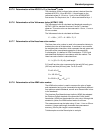
automatically correlated to the color reference solutions. This
means that the color reference solution that is closest to the
sample (i.e. the reference solution with the smallest color
difference E* to the color of the sample) is displayed. The values
L*, a* and b* are the quantitative differences between the L*,
a* and b* values of the sample and those of the displayed USP
solutions.
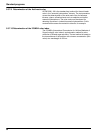
The measurements can be taken using cuvettes with path lengths
of 10 mm, 11 mm or 50 mm. The use of longer path lengths
increases the accuracy of the measurement.