


LS9 Editor Owner’s Manual
79
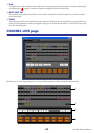
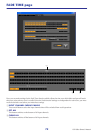
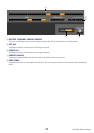
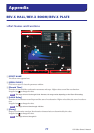
M Filter Frequency Response Curve
The curve changes depending on the HPF and LPF values.
N Reverberation images
These images represent the high-range (10kHz), mid-range (1kHz), and low-range (100Hz) reverberation. These
images change shape depending on the parameter values. The vertical axis represents the level; the horizontal axis
represents reverb time; the shape represents the envelope.
O Reverb time curve
This curve represents the high-range (10kHz), mid-range (1kHz), and low-range (100Hz) reverb time.
The curve changes depending on the Reverb Time, Hi Ratio, and Lo Ratio parameter values.
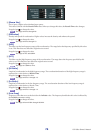
P [Auto Zoom] button
Click the button to automatically adjust the time axis (horizontal axis).
Q Time Axis Set button
Use this button to specify the time duration (in seconds) as displayed by the time axis (horizontal axis).
R [] (Zoom Out) button
Click this button to increase the time value (in seconds) as displayed by the time axis (horizontal axis).
As a result, the display zooms out on the horizontal axis.
S [] (Zoom In) button
Click this button to decrease the time value (in seconds) as displayed by the time axis (horizontal axis).
As a result, the display zooms in on the horizontal axis.
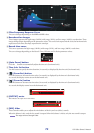
T [OUTPUT] meter
This indicates the output level of the effect.
U [MIX] slider
These controls enable you to adjust the mix balance of the dry and wet (effect) sounds.
When the balance is 0%, only the dry sound is output. When the balance is 100%, only the wet sound is output.
The range is from 0 through 100%.
7
8
M
N
O
N
N
J
K
L
P
Q
R S
6
T
U
R S
NOTE