


Chapter 11. Logging
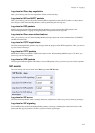
interface will generate one graph per interface. You can also select to view only VPN traffic.
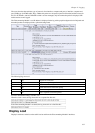
Direction
Select one or more of Sent, Received and Sent+Received. Each selection generates a separate graph in the diagram.
Value
Select maximum, average or minimum value of each sample period. If viewing load for time periods within the last
week, all three selections will result in the same graph.
Unit
Select between displaying packets/second or bits/second. The graphs may look different, because all packets aren’t
the same size.
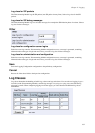
Diagram Size
Enter the desired width and height of the resulting load diagram.
Heading
You can enter a heading for the load diagram. This is useful if you view several diagrams and save them.
Max Value
Enter the maximum value to show in the diagram. If no value is entered, the diagram automatically scales to a
suitable value.
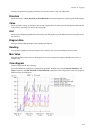
View diagram
Creates a diagram at the top of the page.
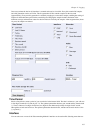
For each combination of selections, a graph will be generated. Example: You selected Network Interface 1 and
Total as interfaces, and Sent, Received and Sent+Received as directions. This will generate a total of six graphs of
different colours in the diagram.
104