


Section 3Edition 3
Rev G
3-8
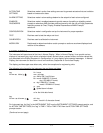
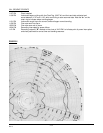
Trends can be zoned into two different areas to allow for higher resolution on one end of the recorded span. The
recorded area used on the chart for a trend may not necessarily use the entire area available for recording.
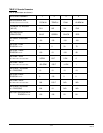
Engineering unit values are printed next to the corresponding scale lines. The ZONE 1 LOW DIVISION param-
eter in RECORDERS section of CONFIGURATION specifies the position on the chart corresponding to the
bottom of zone 1 and the ZONE 1 HIGH DIVISION parameter specifies the position on the chart corresponding to
the top of zone 1 (and the bottom of zone 2 if zone 2 is used). The ZONE 2 HIGH DIVISION parameter specifies
the position on the chart corresponding to the top of zone 2, with zero specifying that zone 2 is not used.
The SPAN 1 LOW parameter specifies the value corresponding to the bottom of zone 1 and SPAN 1 HIGH
parameter specifies the value corresponding to the top of zone 1 and bottom of zone 2 (if used). The SPAN 2
HIGH parameter specifies the value corresponding to the top of zone 2. If the zone 2 parameter is zero, zone 2
is inactive or not used.
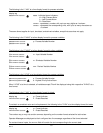
The DIVISION parameters specify location relative to the CHART DIVISIONS parameter (or number of chart
rings), which corresponds to the usable recording span of the chart.
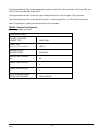
The SCALE INTERVAL parameters specify the number of divisions between printed scale values. The values
printed are calculated by the instrument. If the SCALE INTERVAL parameter is zero, no scale is printed, but the
recorder tag will be printed.
Values corresponding to the bottom of the recordable area are located slightly upscale so that they are printable.
Values corresponding to the top of the recordable area are located slightly downscale so that they do not interfere
with the time and date. All other values are centered vertically on the corresponding concentric circle.
The UNITS that are configured for display are printed next to the outermost scale value.
The RECORDER TAG for each recorded trend is printed underneath the outermost scale value.
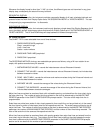
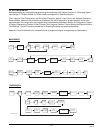
The CHART TAG, time, and date are printed just beyond the recording area, at successive major time lines as
follows:
On 10" and 12" Charts:
CHART TAG TIME DATE TIME
On 11" Charts:
CHART TAG DATE CHART TAG DATE
TIME TIME TIME TIME
The color of the scale line, scale values, units, and recorder tag always correspond to the trend for which they
apply.
The color of the major time lines, minor time lines, time, and date/chart tag are each programmable.
3.8.1 CHART PRINTING INTERRUPTIONS
When chart printing is interrupted momentarily, the printing resumes as though no interruption had occurred.
If the interruption lasts beyond the point at which data should have been printed, the chart will advance to the
appropriate point, printing minor and major time lines as needed, and resume trending.
If the interruption lasts long enough such that no data would be printed between successive major time divisions,
the divisions will not be printed.
When power is restored, the chart is marked with an arrow (" ") to indicate the point of power interuption.