


Section 3Edition 3
Rev G
3-12
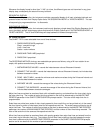
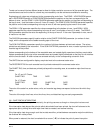
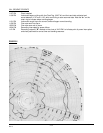
3.8.4 SEQUENCE OF EVENTS
11:27 PM Chart installed
11:30 PM Instrument began printing with the Chart Tag, (UNIT #1) and the trend data collected and
saved between 11:27 and 11:30, while continuing to save scanned data. Note the "❿" on the
outer ring to indicate where trending began
11:31 PM Instrument caught up to the current time and began normal trending.
11:50 PM Flow rate went into alarm.
12:20 PM Flow rate came out of alarm.
12:54 PM Recording interrupted by power failure.
1:12 PM Recording restored, "" marked on the chart at X:XX PM to indicate point of power interruption
and chart positioned to correct time and trending resumes.
FIGURE 3-2