


E-66
Displaying the Measurement Results
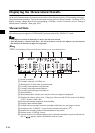
Color Difference Graph
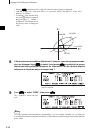
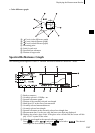
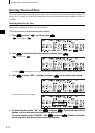
The following screen appears if “COLOR GRAPH” has been selected for “DISPLAY” mode. The
L*a*b* color difference value and the assessment message will be displayed in this screen regardless of
the color space selected for “COLOR SPACE” condition item. The data will be plotted in a color differ
-
ence graph with the selected target color as the origin.
(If “
*
/I+E” has been selected as specular component mode, only the graph will be displayed. Color dif-
ference value and assessment message will not be displayed.)
Note
• If no target color has been selected, no color difference will be displayed and the graph will be blank.
• If the target mode is “linked to each data.”, you will not be able to view the color difference for measurement
data that uses the deleted color difference target data.
M
emo
“#####” will be displayed if the color difference data has two or more decimal places.
1 Ready to measure.
2 Currently selected <COND
*
> no.
3 Mask/gloss/UV at the time of measurement
4 Currently selected target color data no.
5 Measured data.
6 Color difference graph
7 Currently selected measured data no.
8 Currently selected observer/illuminant
9 Measurement date. For the year, only the lower two digits are displayed.
0 Displays the relative gloss value. If the gloss value exceeds 200, the screen will display
“G###” in place of the value.
A Deletes the currently displayed measured data.
B Displays other measured data.
C Switches the screen page from one to another (when there are two pages or more).
D Switches to the <TARGET> screen for the currently selected no. (T
*
).
E Outputs the currently displayed measured data to the printer.
F Returns to the <COND
*
> screen.
G Appears if there is insufficient battery power when the instrument is powered by the bat-
tery. If appears, replace the batteries with new ones.