


E-67
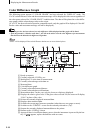
Displaying the Measurement Results
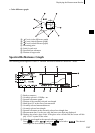
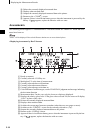
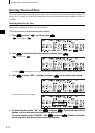
• Color difference graph
H L* axis (color difference graph)
I a* axis (color difference graph)
J b* axis (color difference graph)
K Measuring point
L Scale for each axis
M Specified box tolerances
N Position of target color
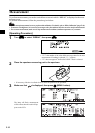
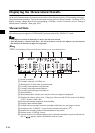
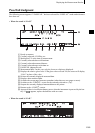
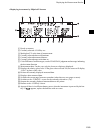
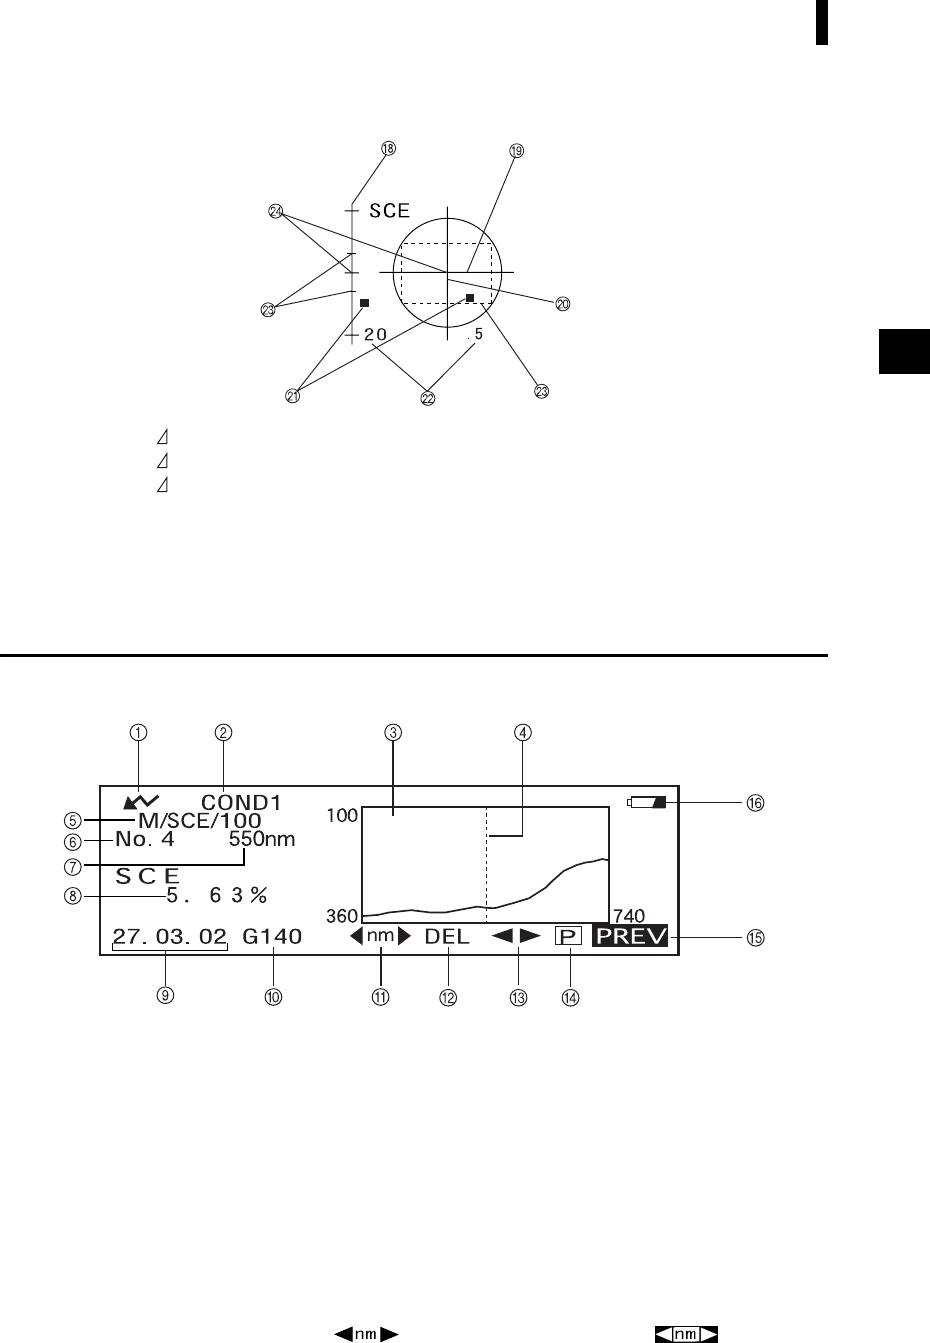
Spectral Reflectance Graph
The following screen appears if “SPECT. GRAPH” has been selected for “DISPLAY” mode.
1 Ready to measure.
2 Currently selected <COND
*
> no.
3 Spectral reflectance graph
4 Position of the currently selected wavelength
5 Mask/gloss/UV at the time of measurement
6 Currently selected measured data no.
7 Currently selected wavelength
8 Spectral reflectance at the currently selected wavelength data
9 Measurement date. For the year, only the lower two digits are displayed.
0 Displays the relative gloss value. If the gloss value exceeds 200, the screen will dis-
play “G###” in place of the value.
A Select the wavelength in the spectral reflectance graph.
Turn B to select and press A to switch to . The desired
wavelength can be selected by turning B.