


E-70
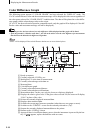
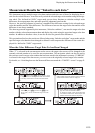
Displaying the Measurement Results
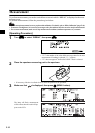
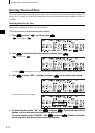
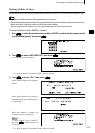
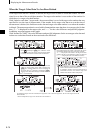
Switching the Display Contents of the Measurement Results
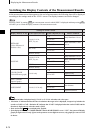
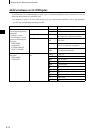
In the measurement screen that appears at the end of measurement, the following data will be displayed
according to the settings made in the <FILE> screen. The display contents can also be changed.
M
emo
Selecting “DISP” by turning B in a measurement screen in which “DISP” is displayed and then pressing A
will allow you to switch the display contents of the measurement results.
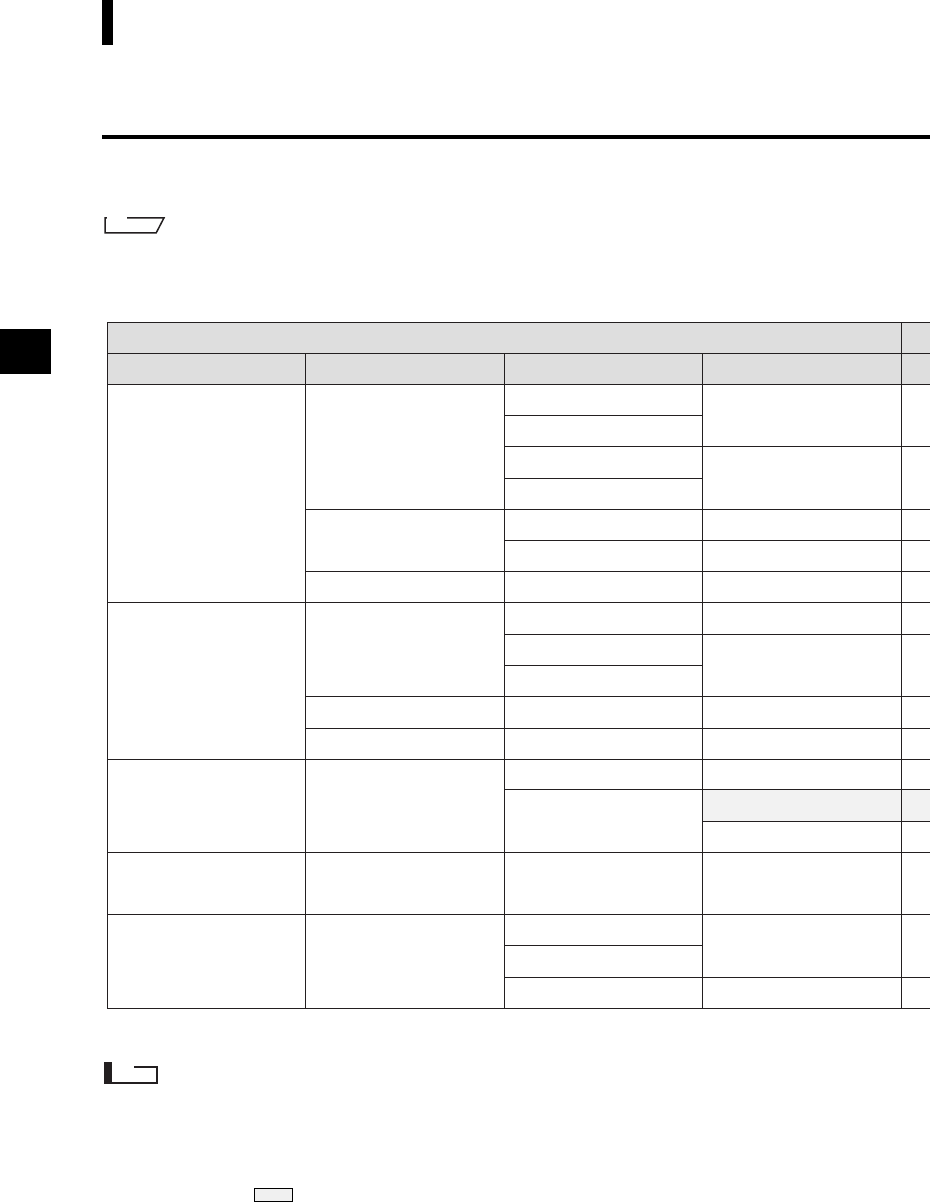
Settings in <FILE> Screen
Display Mode (P. E-38) Color Space (P. E-39)
Specular component (P. E-35)
Other Conditions
DIFF&ABS
(Color difference &
absolute value)
L*a*b*, L*C*h,
XYZ, Yxy etc.
WI, YI etc.
Munsell, density
PASS/FAIL
L*a*b*, L*C*h,
XYZ, Yxy etc.
WI, YI etc.
Munsell, density
L*a*b* only
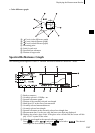
COLOR GRAPH
(Color difference graph)
L*a*b*, L*C*h only
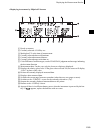
ASSESSMENT
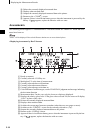
SPECT. GRAPH
(Spectral graph)
I + E
SCI or SCE
I + E
SCI or SCE
I + E
SCI or SCE
I + E
SCI or SCE
Japanese only
Box tolerance
Elliptical tolerance
I + E
SCI or SCE
I + E
SCI or SCE
Only illuminant 1 is set.
Both illuminants 1 and 2
are set.
Only illuminant 1 is set.
Both illuminants 1 and 2
are set.
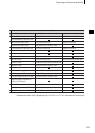
Note
• Metamerism index is displayed only if L*a*b* or L*C*h is selected as the color space.
• “Deviation A” indicates that the direction in relation to the target color is displayed, irrespective of whether the
results are PASS or FAIL. “Deviation B” indicates that “PASS” is displayed when the result is PASS and the
direction is displayed only when the result is FAIL.
• Items enclosed by are not displayed in English.
• If the display mode is set to “COLOR GRAPH” and the MASK/GLOSS is set to “*/I+E”, the system will display
graphs for light source #1 only. If you set the system to use two different sources, only graphs for source #1 will
be shown.