


Model 8904A Service
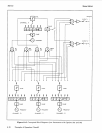
D7E
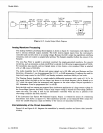
SAMPLER
f=pjT
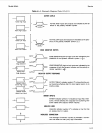
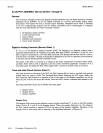
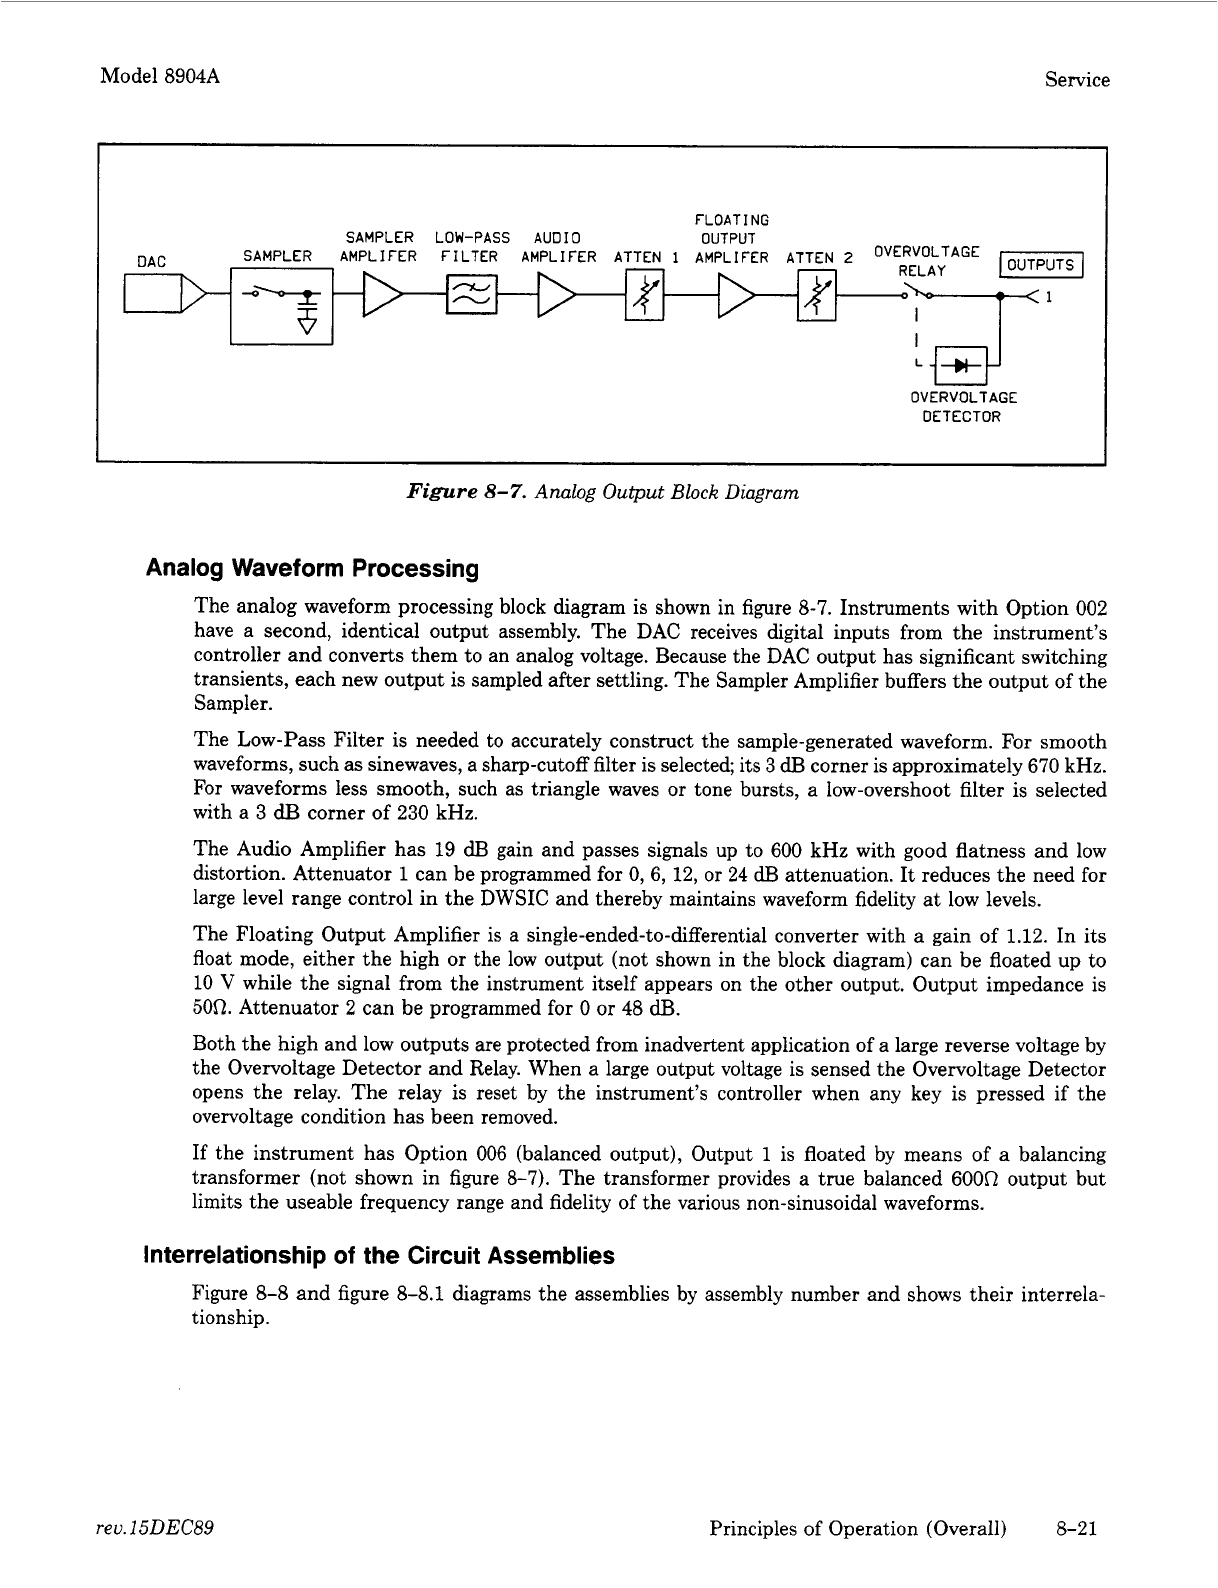
Figure
8-7.
Analog
Output
Block
Diagram
Analog Waveform Processing
The analog waveform processing block diagram is shown in figure
8-7.
Instruments with Option
002
have a second, identical output assembly. The DAC receives digital inputs from the instrument’s
controller and converts them to an analog voltage. Because the DAC output has significant switching
transients, each new output
is
sampled after settling. The Sampler Amplifier buffers the output
of
the
Sampler.
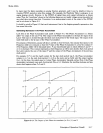
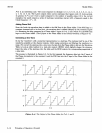
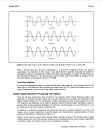
The Low-Pass Filter is needed to accurately construct the sample-generated waveform. For smooth
waveforms, such as sinewaves, a sharp-cutoff filter is selected its
3
dl3
corner is approximately
670
kHz.
For waveforms less smooth, such as triangle waves
or
tone bursts, a low-overshoot filter is selected
with a
3
dE3
corner of
230
kHz.
The Audio Amplifier has 19
dEl
gain and passes signals up to
600
kHz
with good flatness and low
distortion. Attenuator
1
can be programmed for
0,
6,
12,
or
24
dB
attenuation. It reduces the need for
large level range control in the DWSIC and thereby maintains waveform fidelity at low levels.
The Floating Output Amplifier
is
a single-ended-to-differential converter with a gain of 1.12. In its
float mode, either the high
or
the low output (not shown in the block diagram) can be floated up to
10
V
while the signal from the instrument itself appears on the other output. Output impedance is
50R.
Attenuator
2
can be programmed for
0
or
48
dB.
Both the high and low outputs are protected from inadvertent application of a large reverse voltage by
the Overvoltage Detector and Relay. When a large output voltage is sensed the Overvoltage Detector
opens the relay. The relay is reset by the instrument’s controller when any key
is
pressed if the
overvoltage condition has been removed.
If the instrument has Option
006
(balanced output), Output
1
is floated by means of a balancing
transformer (not shown in figure
8-7).
The transformer provides a true balanced
600n
output but
limits the useable frequency range and fidelity
of
the various non-sinusoidal waveforms.
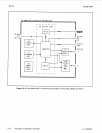
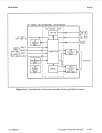
Interrelationship
of
the Circuit Assemblies
Figure
8-8
and figure
8-8.1
diagrams the assemblies by assembly number and shows their interrela-
tionship.
reu.15DEC89
Principles of Operation (Overall) 8-21