


116
MODEL 3081 pH/ORP SECTION 13.0
pH MEASUREMENTS
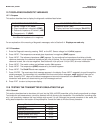
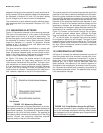
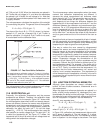
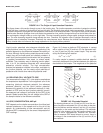
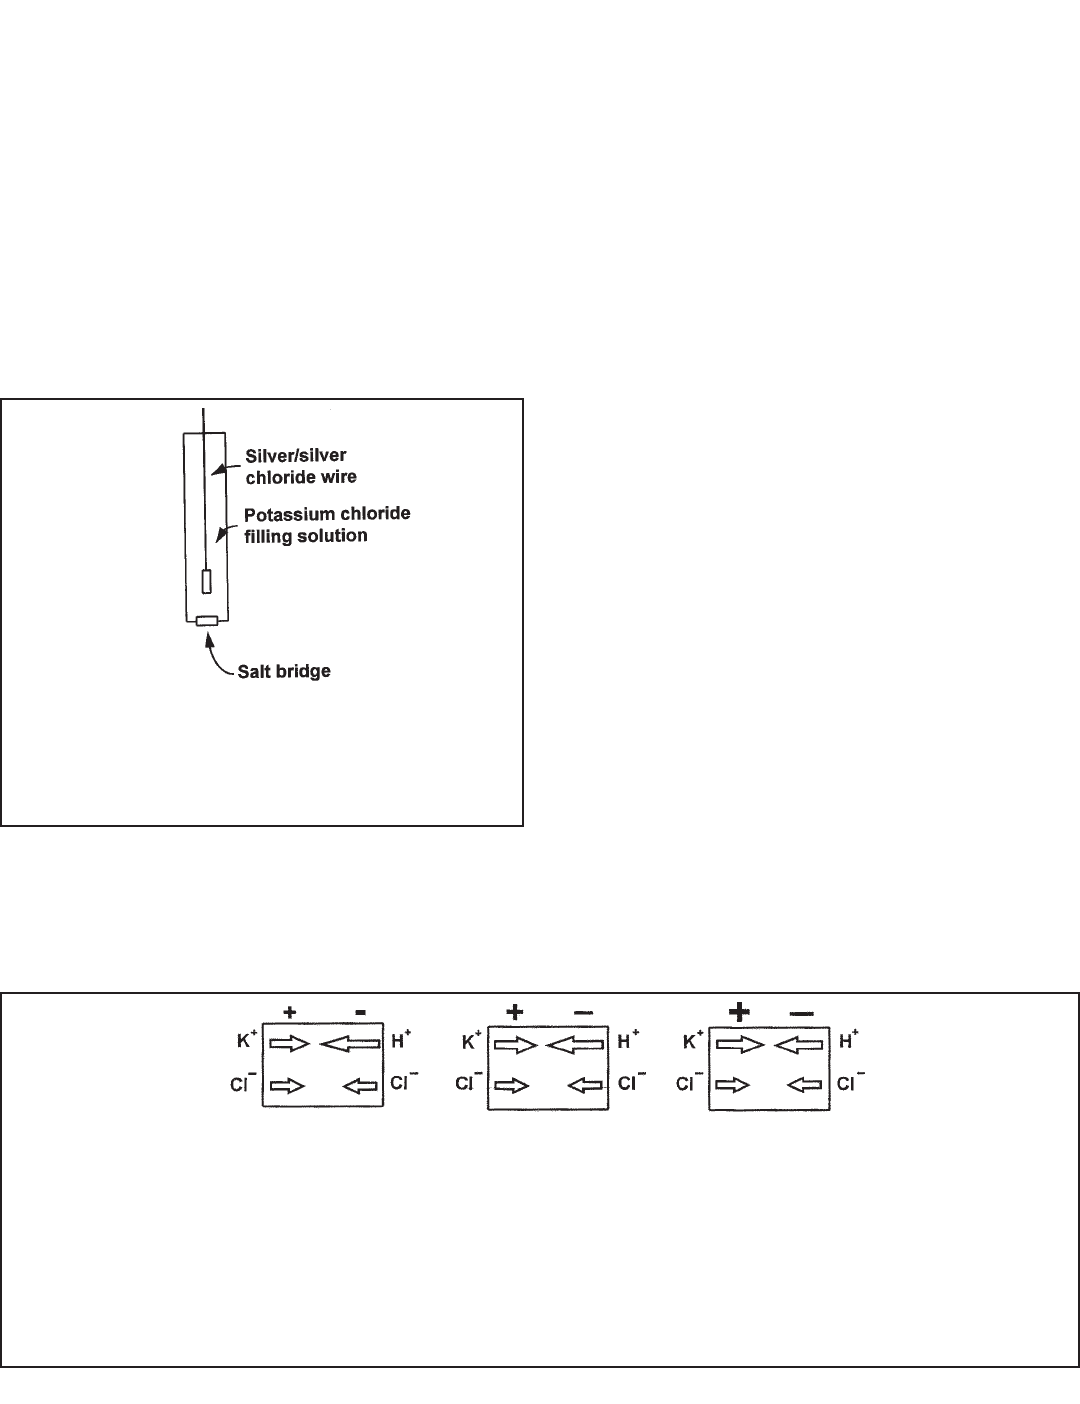
FIGURE 13-5. The Origin of Liquid Junction Potentials.
The figure shows a thin section through a pore in the junction plug. The junction separates a solution of potassium chloride on
the left from a solution of hydrochloric acid on the right. The solutions have equal molar concentration. Driven by concentration
differences, hydrogen ions and potassium ions diffuse in the directions shown. The length of each arrow indicates relative rates.
Because hydrogen ions move faster than potassium ions, positive charge builds up on the left side of the section and negative
charge builds up on the right side. The ever-increasing positive charge repels hydrogen and potassium ions. The ever-increas-
ing negative charge attracts the ions. Therefore, the migration rate of hydrogen decreases, and the migration rate of potassi-
um increases. Eventually the rates become equal. Because the chloride concentrations are the same, chloride does not influ-
ence the charge separation or the liquid junction potential.
13.4 LIQUID JUNCTION POTENTIAL
The salt bridge (see Figure 13-4) is an integral part of the ref-
erence electrode. It provides the electrical connection
between the reference electrode and the liquid being meas-
ured. Salt bridges take a variety of forms, anything from a
glass frit to a wooden plug. Salt bridges are highly porous,
and the pores are filled with ions. The ions come from the fill-
ing solution and the sample. Some bridges permit only diffu-
sion of ions through the junction. In other designs, a slow
outflow of filling solution occurs. Migration of ions in the
bridge generates a voltage, called the liquid junction poten-
tial. The liquid junction potential is in series with the measur-
ing and reference electrode potentials and is part of the over-
all cell voltage.
Figure 13-5 helps illustrate how liquid junction potentials
originate. The figure shows a section through a pore in the
salt bridge. For simplicity, assume the bridge connects a
solution of potassium chloride and hydrochloric acid of equal
molar concentration. Ions from the filling solution and ions
from the sample diffuse through the pores. Diffusion is driv-
en by concentration differences. Each ion migrates from
where its concentration is high to where its concentration is
low. Because ions move at different rates, a charge separa-
tion develops. As the charge separation increases, electro-
static forces cause the faster moving ions to slow down and
the slower moving ions to speed up. Eventually, the migra-
tion rates become equal, and the system reaches equilibri-
um. The amount of charge separation at equilibrium deter-
mines the liquid junction potential.
Liquid junction potentials exist whenever dissimilar elec-
trolyte solutions come into contact. The magnitude of the
potential depends on the difference between the mobility of
the ions. Although liquid junction potentials cannot be elim-
inated, they can be made small and relatively constant. A
small liquid junction potential exists when the ions present
in greatest concentration have equal (or almost equal)
mobilities. The customary way of reducing junction poten-
tials is to fill the reference electrode with concentrated
potassium chloride solution. The high concentration
ensures that potassium chloride is the major contributor to
the junction potential, and the nearly equal mobilities of
potassium and chloride ions makes the potential small.
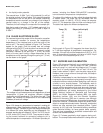
13.5 CONVERTING VOLTAGE TO pH
Equation 1 summarizes the relationship between meas-
ured cell voltage (in mV), pH, and temperature (in Kelvin):
E(T) = E
°
(T) + 0.1984 T pH (1)
The cell voltage, E(T)—the notation emphasizes the
dependence of cell voltage on temperature—is the sum of
five electrical potentials. Four are independent of the pH of
the test solution and are combined in the first term, E
°
(T).
These potentials are listed below:
1. the potential of the reference electrode inside the glass
electrode
2. the potential at the inside surface of the glass mem-
brane
3. the potential of the external reference electrode
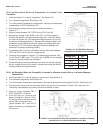
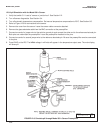
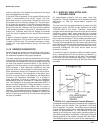
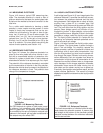
FIGURE 13-4. Reference Electrode.
The fixed concentration of chloride inside the electrode
keeps the potential constant. A porous plug salt bridge at
the bottom of the electrode permits electrical contact
between the reference electrode and the test solution.