117
MODEL 3081 pH/ORP SECTION 13.0
pH MEASUREMENTS
4. the liquid junction potential.
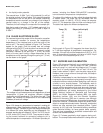
The second term, 0.1984 T pH, is the potential (in mV) at
the outside surface of the pH glass. This potential depends
on temperature and on the pH of the sample. Assuming
temperature remains constant, any change in cell voltage is
caused solely by a change in the pH of the sample.
Therefore, the cell voltage is a measure of the sample pH.
Note that a graph of equation 1, E(T) plotted against pH, is a
straight line having a y-intercept of E
°
(T) and a slope of
0.1984 T.
13.6 GLASS ELECTRODE SLOPE
For reasons beyond the scope of this discussion, equation
1 is commonly rewritten to remove the temperature
dependence in the intercept and to shift the origin of the
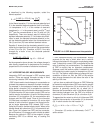
axes to pH 7. The result is plotted in Figure 13-6. Two lines
appear on the graph. One line shows how cell voltage
changes with pH at 25°C, and the other line shows the rela-
tionship at 50°C. The lines, which are commonly called
isotherms, intersect at the point (pH 7, 0 mV). An entire
family of curves, each having a slope determined by the
temperature and all passing through the point (pH 7, 0 mV)
can be drawn on the graph.
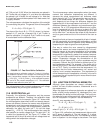
Figure 13-6 shows why temperature is important in making pH
measurements. When temperature changes, the slope of the
isotherm changes. Therefore, a given cell voltage corresponds
to a different pH value, depending on the temperature. For
example, assume the cell voltage is -150 mV. At 25°C the pH
is 9.54, and at 50°C the pH is 9.35. The process of select-
ing the correct isotherm for converting voltage to pH is
called temperature compensation. All modern process pH
meters, including the Model 3081pH/ORP transmitter,
have automatic temperature compensation.
The slope of the isotherm is often called the glass electrode
or sensor slope. The slope can be calculated from the
equation: slope = 0.1984 (t + 273.15), where t is tempera-
ture in °C. The slope has units of mV per unit change in pH.
The table lists slopes for different temperatures.
Temp (°C) Slope (mV/unit pH)
15 -57.2
20 -58.2
25 -59.2
30 -60.1
35 -61.1
As the graph in Figure 13-6 suggests, the closer the pH is
to 7, the less important is temperature compensation. For
example, if the pH is 8 and the temperature is 30°C, a 10°C
error in temperature introduces a pH error of ±0.03. At pH
10, the error in the measured pH is ±0.10.
13.7 BUFFERS AND CALIBRATION
Figure 13-6 shows an ideal cell: one in which the voltage is
zero when the pH is 7, and the slope is 0.1984 T over the
entire pH range. In a real cell the voltage at pH 7 is rarely
zero, but it is usually between -30 mV and +30 mV. The
slope is also seldom 0.1984 T over the entire range of pH.
However, over a range of two or three pH units, the slope is
usually close to ideal.
Calibration compensates for non-ideal behavior. Calibration
involves the use of solutions having exactly know pH, called
calibration buffers or simply buffers. Assigning a pH value to
a buffer is not a simple process. The laboratory work is
demanding, and extensive theoretical work is needed to
support certain assumptions that must be made. Normally,
establishing pH scales is a task best left to national stan-
dards laboratories. pH scales developed by the United
States National Institute of Standards and Technology
(NIST), the British Standards Institute (BSI), the Japan
Standards Institute (JSI), and the German Deutsche
Institute für Normung (DIN) are in common use. Although
there are some minor differences, for practical purposes the
scales are identical. Commercial buffers are usually trace-
able to a recognized standard scale. Generally, commercial
buffers are less accurate than standard buffers. Typical
accuracy is ±0.01 pH units. Commercial buffers, sometimes
called technical buffers, do have greater buffer capacity.
They are less susceptible to accidental contamination and
dilution than standard buffers.
Figure 13-7 shows graphically what happens during cali-
bration. The example assumes calibration is being done at
FIGURE 13-6. Glass Electrode Slope.
The voltage of a pH measurement cell depends on pH and
temperature. A given pH produces different voltages
depending on the temperature. The further from pH 7, the
greater the influence of temperature on the relationship
between pH and cell voltage.


