


118
MODEL 3081 pH/ORP SECTION 13.0
pH MEASUREMENTS
pH 7.00 and pH 10.00. When the electrodes are placed in
pH 7 buffer the cell voltage is V
7
, and when the electrodes
are placed in pH 10 buffer, the cell voltage is V
10
. Note that
V
7
is not 0 mV as would be expected in an ideal sensor, but
is slightly different.
The microprocessor calculates the equation of the straight
line connecting the points. The general form of the equation
is:
E = A + B (t + 273.15) (pH - 7) (2)
The slope of the line is B (t + 273.15), where t is the tem-
perature in °C, and the y-intercept is A. If pH 7 buffer is
used for calibration, V
7
equals A. If pH 7 buffer is not used,
A is calculated from the calibration data.
The microprocessor then converts subsequent cell voltage
measurements into pH using the calibration line.
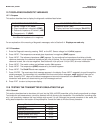
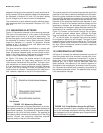
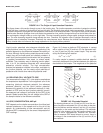
13.8 ISOPOTENTIAL pH
Frequently, the calibration temperature and the process
temperature are different. Therefore, the calibration slope
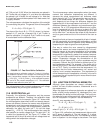
is not appropriate for the sample. Figure 13-7 shows what
the microprocessor does when buffer and sample temper-
atures are different. Assume the sensor was calibrated at
temperature t
1
and the process temperature is t
2
. To meas-
ure the pH of the process, the microprocessor rotates the
calibration line about the point (pH 7, A) until the slope
equals B (t
2
+ 273.15). The microprocessor then uses the
new isotherm to convert voltage to pH. The point (pH 7, A)
is called the isopotential pH. As Figure 13-7 shows, the
isopotential pH is the pH at which the cell voltage does not
change when the temperature changes.
The microprocessor makes assumptions when the meas-
urement and calibration temperatures are different. It
assumes the actual measurement cell isotherms rotate
about the point (pH 7, A). The assumption may not be cor-
rect, so the measurement will be in error. The size of the
error depends on two things: the difference between the
isopotential pH of the measurement cell and pH 7 and the
difference between the calibration and measurement tem-
peratures. For a 10°C temperature difference and a differ-
ence in isopotential pH of 2, the error is about ±0.07 pH
units. The factors that cause the isopotential pH of a real
cell to differ from 7 are beyond the scope of this discussion
and to a great extent are out of the control of the user as
well.
Most pH cells do not have an isopotential pH point. Instead,
the cell isopotential pH changes with temperature, and the
cell isotherms rotate about a general area. Measuring the
isopotential pH requires great care and patience.
One way to reduce the error caused by disagreement
between the sensor and meter isopotential pH is to cali-
brate the sensor at the same temperature as the process.
However, great care must be exercised when the buffer
temperature is significantly greater than ambient tempera-
ture. First, the buffer solution must be protected from evap-
oration. Evaporation changes the concentration of the
buffer and its pH. Above 50°C, a reflux condenser may be
necessary. Second, the pH of buffers is defined over a lim-
ited temperature range. For example, if the buffer pH is
defined only to 60°C, the buffer cannot be used for calibra-
tion at 70°C. Finally, no matter what the temperature, it is
important that the entire measurement cell, sensor and
solution, be at constant temperature. This requirement is
critical because lack of temperature uniformity in the cell is
one reason the cell isopotential point moves when the tem-
perature changes.
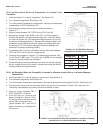
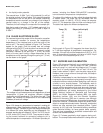
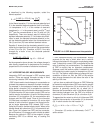
13.9 JUNCTION POTENTIAL MISMATCH
Although glass electrodes are always calibrated with
buffers, the use of buffers causes a fundamental error in
the measurement.
When the glass and reference electrodes are placed in a
buffer, a liquid junction potential, E
lj
, develops at the inter-
face between the buffer and the salt bridge. The liquid junc-
tion potential is part of the overall cell voltage and is includ-
ed in A in equation 2. Equation 2 can be modified to
show E
lj
, as a separate term:
E = A’ + E
lj
+ B (t + 273.15) (pH - 7) (3)
or
E = E’ (pH, t) + E
lj
(4)
where E’ (pH, t) = A’ + B (t + 273.15) (pH - 7).
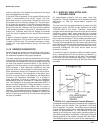
In Figure 13-8, calibration and measurement data are plot-
ted in terms of equation 4. The cell voltage, E, is repre-
sented by the dashed vertical line. The contribution of each
term in equation 4 to the voltage is also shown. The liquid
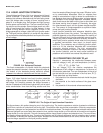
FIGURE 13-7. Two-Point Buffer Calibration.
The graph shows a calibration using pH 7 and pH 10 buffers.
The calibration equation is the straight line connecting the two
points. If temperature changes, the slope changes by the ratio
(t
2
+ 273.15)/(t
1
+ 273.15), where t
1
is the calibration tempera-
ture and t
2
is the process temperature in °C. The calibration
equations rotate about the point (pH 7, A).
t
1
t
2
(pH10, V
10
)
(pH7, V
7
)