


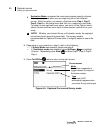
97 Running and viewing curves
Curve measurements and results
Models SE and DL
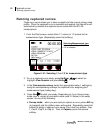
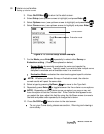
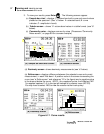
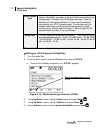
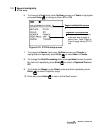
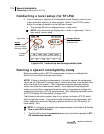
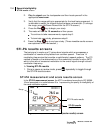
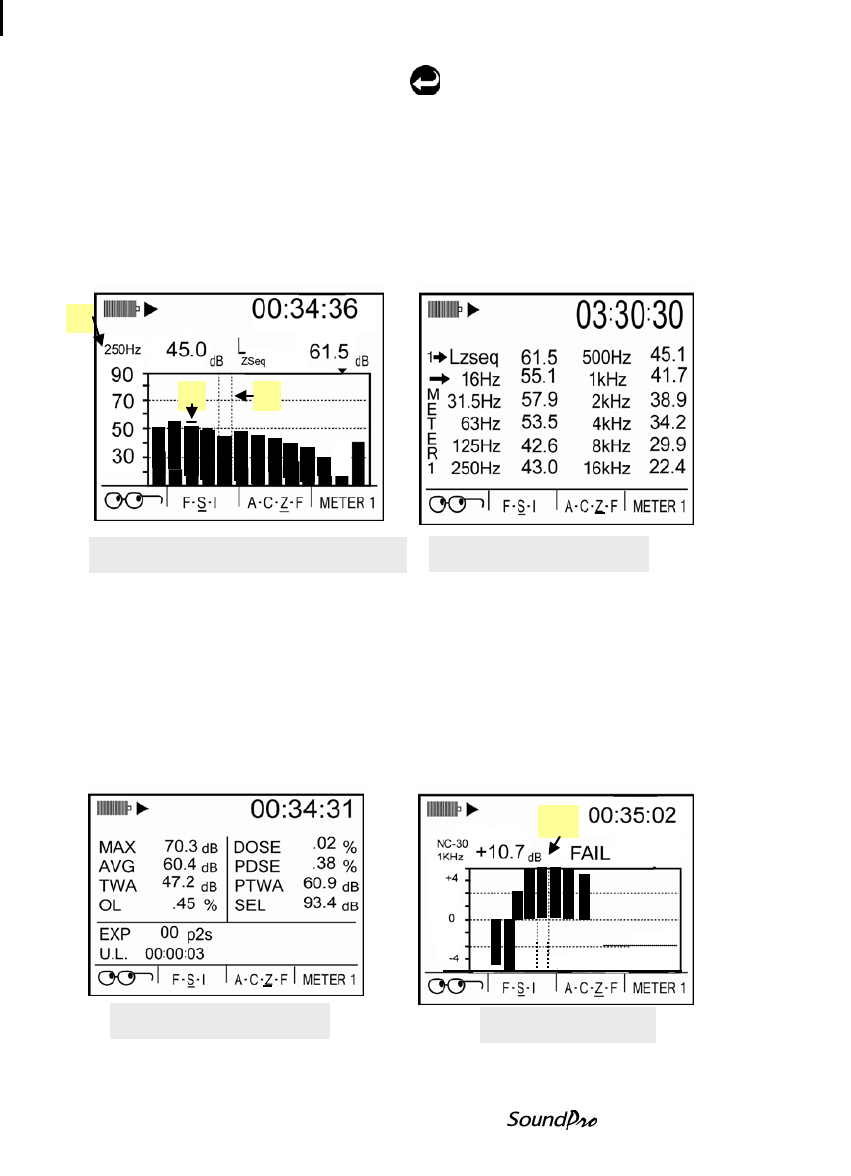
3. To view your results, press Enter . The following screens appear.
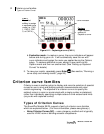
(a) Sample bar chart – displays 1/1 octave band with curve and sound values
plotted on the spectrum. (See “a” below: A- selected band, B- curve
indicator, C- amplitude in band).
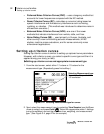
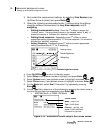
(b) Tabular screen – shows 1/1 octave band values in a table format. (see “b”
below).
(c) Community noise – displays community noise (Please see “Community
Noise screen”, on page 69 for a screen example.)
(d) Dosimetry screen - shows dosimetry measurements (see “e” below).
(e) Delta screen – displays difference between the selected curve and current
measurement, in each filter band. A positive value is the amount exceeding the
curve (see “e Delta screen” and reference “A” in the figure) and a negative value
is the amount below the curve. NOTE: for a captured curve, it will display CAP-
1(or applied captured 1-4) in the top left instead of a criterion curve (NC-30).
You may have to select LEQ to view the results via the Look-up key.
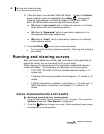
Figure 6-17: Curve results
A
B
C
A
(a) Sample bar chart with curves
(b) Tabulation screen
(d) Dosimetry screen
(e) Delta screen