84 Additional options
Reverberation results
studies, you may want to review the data at the end of the session. In this
example, you would access the File\Session\Data File screen and select a
past study. (For more information, see “Viewing past sessions/studies” in
Chapter 7.)
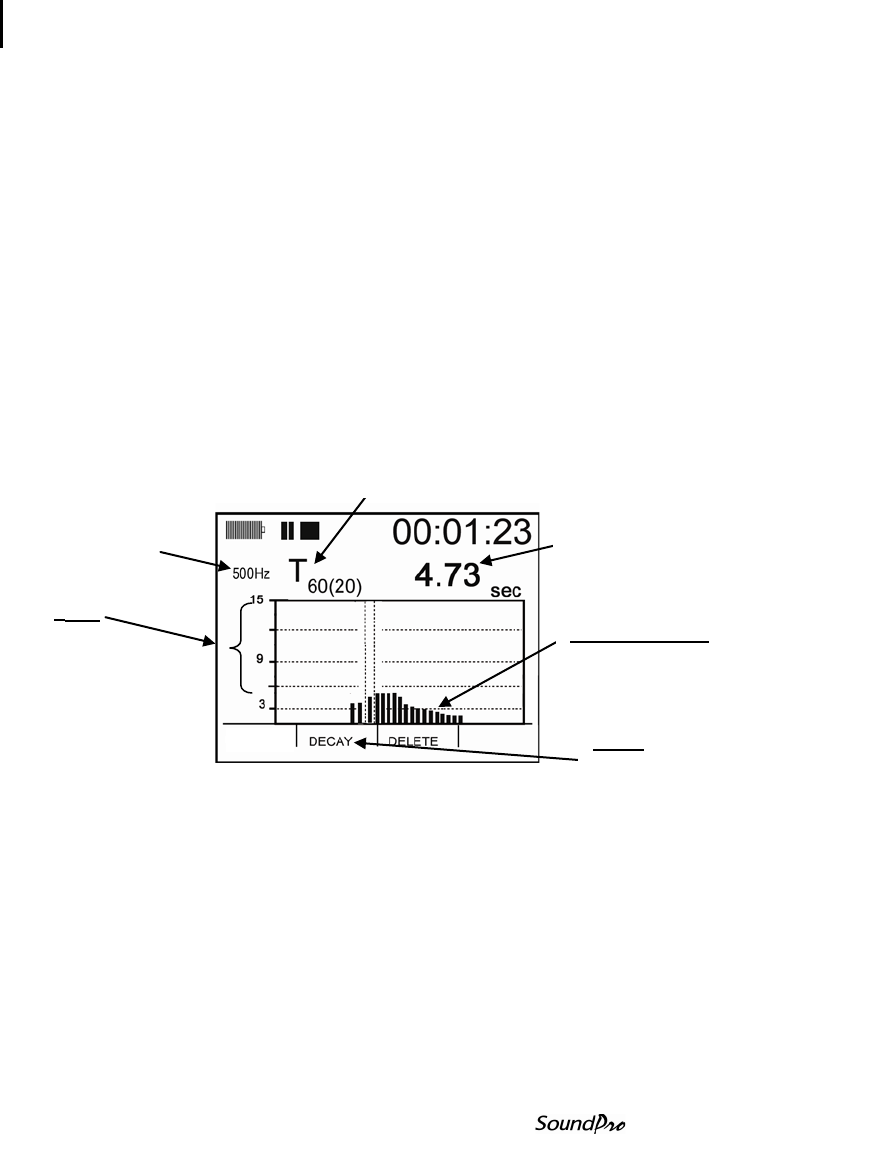
RT60 summary screen
This is a vertical bar chart that will plot the T60 values taken from each octave
band or 1/3 octave band.
Viewing RT60 values of each band
1. The decay value for each specific band is viewable by pressing the
left/right arrow keys.
NOTE: Bands with invalid T60 values will show dashes (---) instead of a
value.
Figure 6-5: RT60 bar chart screen
Deleting RT60 value in a filtered band
This optional feature allows you to delete a selected filtered band from the
session average and is available when in review mode of “view current study”
screens. (This may be used, if for example, you had someone accidentally
walk in during your test and begin speaking. You could delete the bands
which interfered with your test from the RT60 average results.)
1. To delete a filtered band, select either the RT60 Summary screen or the
Decay curve screen.
Displays the RT60 filter
60(20)
States that T60
measurement was
extrapolated from a
T
20
measure.
selected band.
results, press softkey)