


86 Additional options
Reverberation results
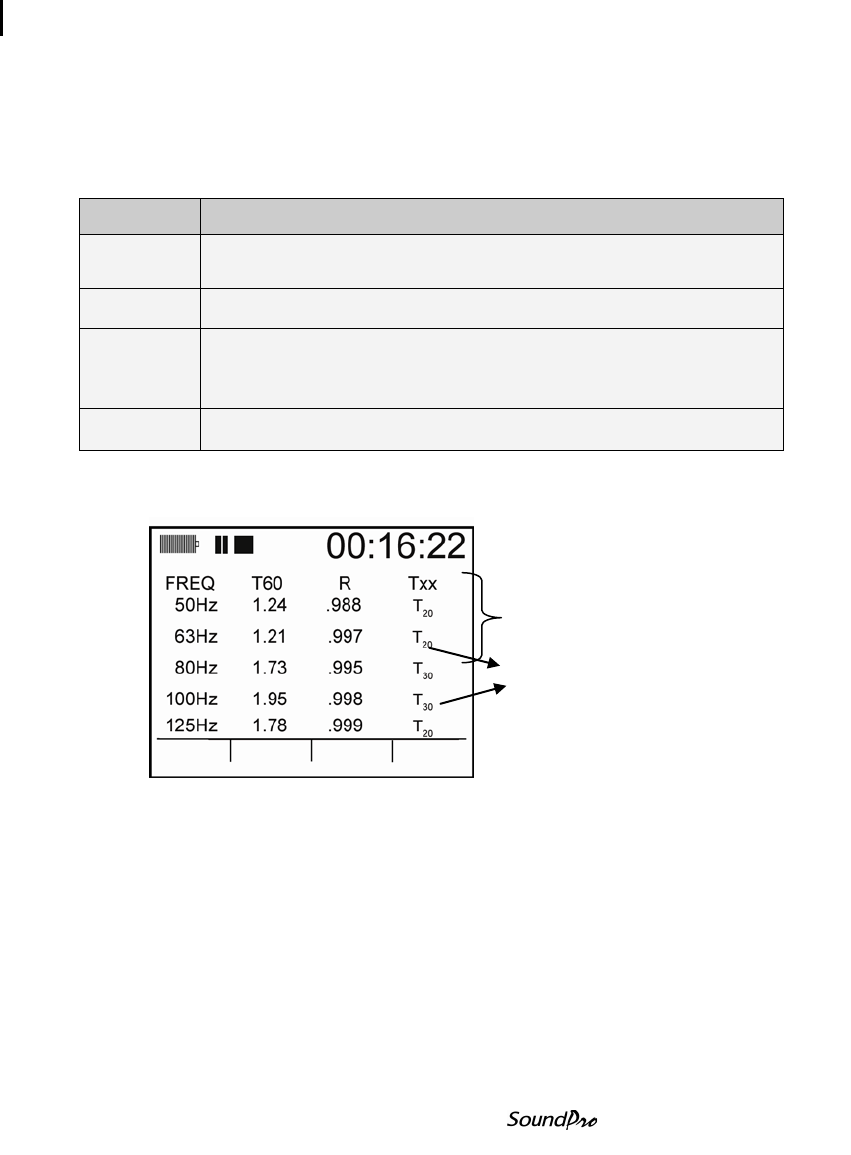
Models SE and DL
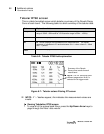
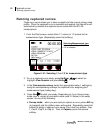
Tabular RT60 screen
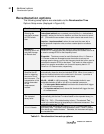
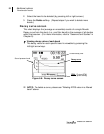
This is a table-formatted screen which details a summary of the Reverb Decay
Curve of each band. The following table is a brief summary of the tabular data.
Table 6-2: Tabular RT60 field explanation
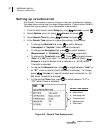
Figure 6-7: Tabular octave filtering RT screen
NOTE: if “---”dashes appear, this indicates the measurement values are
invalid.
Viewing Tabulation RT60 screen
1. To view all of the octave band filters, press the Up/Down Arrow keys to
page through the filters’ data results.
Column
Explanation of data
Freq
The Frequency column displays the chosen filter bands (for 1/1 Octave the
range is 63Hz – 8KHz and for 1/3 Octave the range is 50Hz – 10KHz).
T60
T60 column displays the results of the decay curve in seconds.
R
2
R
2
column displays the reverberation time measurements. The values
represent a “goodness to fit” ranging between 0 to 1 values, where 0 = failed
and 1 = perfect.
Txx
Txx column displays the actual measurements of the RT60s’ values.
Summary of the Reverb
Decay curve results for each
octave band.
NOTE: The Txx value may show
different ranges when “Auto” is
selected for the trigger mode.