


Appendix B
143
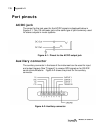
Models SE and DL
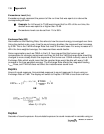
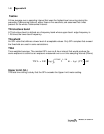
TWA L
avg
ER log
2
Prt
CT
---------
dB+=
PTWA
This is a projected TWA determined for a projected time (Prt) in relation to the Criterion Time
(CT) as follows.
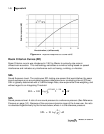
Peak –C
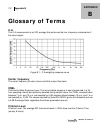
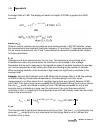
The following chart illustrates the range of Sound Level with C-weighted Peak.
Level Range (dB)
Peak C Level Range (dB)
Level Range (dB)
Peak C Level Range
(dB)
-20 to 70
42.2 to 73
20 to 110
42.7 to 113
-10 to 80
42.6 to 83
30 to 120
46.7 to 123
0 to 90
41.6 to 93
40 to 130
55.4 to 132
10 to 100
43.4 to 103
50 to 140
66.3 to 142
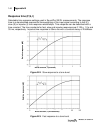
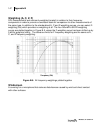
Preferred Noise Criterion (PNC) Curves
The Preferred Noise Criterion Curves, a type of tangency method, was an update to
Beranek’s original NC curves that accounted for the lower frequency side of the criterion
curves (1971). The PNC curves extended the range to 32 Hz instead of 63 Hz used in NC
curves.
Projected time (Prt)
A time interval used in some calculations, usually different from the actual run time of a study
or session.
Reference pressure
The sound pressure at the threshold of human hearing, as measured under standard
conditions. This generally accepted magnitude of this pressure is 2 × 10⁻⁵ Pascals (Pa).