


68 Measurement screens
Bar Chart and Filtered Bar Chart
Models SE and DL
Measurement screens
Bar Chart and Filtered Bar Chart
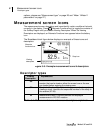
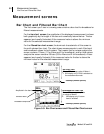
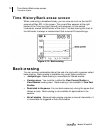
The first screen you’ll see in a viewing area contains a bar chart for broadband or
filtered measurements.
For the bar chart screen, the amplitude of the displayed measurement is shown
both graphically by the length of the bar and numerically below the bar. The bar
appears (and usually fluctuates) if the measured value is above the minimum
value for the selected measurement range.
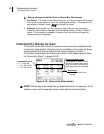
For the filtered bar chart screen, the dominant characteristic of this screen is
the multi-element bar chart. The chart shows measurements in each filter band
and broadband values for both meters. That means that for octave analysis the
screen contains 13 bars (11 for filters and 2 for broadband), and for third-octave
analysis the screen contains 35 bars (33 for filters and 2 for broadband). A bars
appears (and usually fluctuate) if the measured value for the bar is above the
minimum value for the selected measurement range.
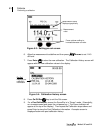
Figure 5-9: Bar Chart screen and Filtered Bar Chart screen
Bar Chart View
Shows SPL average value of Meter 1.
• Will display only if SLM is selected as
the measurement mode.
Broadband amplitude
Amplitude in the band
Selected band
Broadband Bar Chart view
Shows SPL average amplitude
(or value) of Meter 1
• Will display only if octave
band is enabled
Softkeys (menus options)
Softkeys (menus options)