


80386
31
12
11
0
LINEAR ADDRESS
V
0 0 u u w w
0
01
0
0
C
# # #
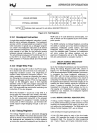
TR6
PHYSICAL ADDRESS
0 0 0 0 0 0 0
P
REP
0 0
L
TR?
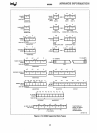
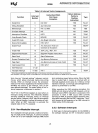
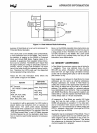
NOTE:
[£]
indicates Intel reserved:
Do
not define; SEE SECTION 2.3.10
Figure 2-12.
Test
Registers
2.12.1
Breakpoint
Instruction
A single·byte-opcode breakpoint instruction
is
avail-
able for use by software debuggers. The breakpoint
opcode
is
OCCh,
and generates
an
exception 3 trap
when executed.
In
typical use, a debugger program
can
"plant" the breakpoint instruction at all desired
code execution breakpoints. The single-byte
break-
point opcode
is
an
alias for the two-byte general
software interrupt instruction,
INT
n,
where n =
3.
The only difference between INT 3
(OCCh)
and INT n
is
that INT 3
is
never IOPL-sensitive but INT n
is
IOPL-sensitive
in
Protected Mode and Virtual 8086
Mode.
2.12.2 Single-Step Trap
If the single-step flag
(TF,
bit
8)
in
the EFLAG regis·
ter is found to be set at the end of
an
instruction, a
single-step exception occurs. The single-step
ex-
ception
is
auto vectored to exception number
1.
Pre-
cisely, exception 1 occurs
as
a trap after the instruc-
tion following the instruction which set TF.
In
typical
practice, a debugger sets the TF bit of a flag register
image
on
the debugger's stack. It then typically
transfers control to the user program and loads the
flag image with a signal instruction, the
IRET instruc-
tion. The single-step trap occurs after executing one
instruction of the user program.
Since the exception 1 occurs
as
a trap (that
is,
it
occurs after the instruction has already executed),
the
CS:EIP pushed onto the debugger's stack points
to the next unexecuted instruction of the program
being debugged.
An
exception 1 handler, merely
by
ending with
an
IRET instruction, can therefore effi-
ciently support single-stepping through a user pro-
gram.
2.12.3 Debug Registers
The Debug Registers are
an
advanced debugging
feature of the
80386. They allow data access break-
points
as
well
as
code execution breakpoints. Since
the breakpoints are indicated by on-chip registers,
an
instruction execution breakpoint can be placed
in
28
ROM
code or
in
code shared
by
several tasks, nei-
ther of which can be supported
by
the INT3 break-
point opcode.
The
80386 contains six Debug Registers, providing
the ability to specify up to four distinct breakpoints
addresses, breakpoint control options, and read
breakpoint status. Initially after reset, breakpoints
are
in
the disabled state. Therefore,
no
breakpoints
will occur unless the debug registers are
pro-
grammed. Breakpoints set
up
in
the Debug Regis-
ters are autovectored to exception number
1.
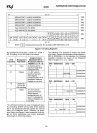
2.12.3.1 LINEAR ADDRESS BREAKPOINT
REGISTERS (DRO-DR3)
Up to four breakpoint addresses can be specified
by
writing into Debug Registers DRO-DR3, shown
in
Figure 2-13. The breakpoint addresses specified are
32-bit linear addresses.
80386 hardware continuous-
ly
compares the linear breakpoint addresses
in
DRO-DR3 with the linear addresses generated by
executing software
(a
linear address
is
the result of
computing the effective address
and
adding the 32-
bit segment base address). Note that if paging
is
not
enabled the linear address equals the physical
ad-
dress.
If
paging
is
enabled, the linear address
is
translated to a physical 32-bit address by the on-
chip paging unit. Regardless of whether paging
is
enabled or not, however, the breakpoint registers
hold linear addresses.
2.12.3.2 DEBUG
CONTROL REGISTER (DR?)
A Debug Control Register,
DR?
shown
in
Figure
2-13, allows several debug control functions such
as
enabling the breakpoints and setting
up
other con-
trol options for the breakpoints. The fields within the
Debug Control Register,
DR?,
are
as
follows:
LENi (breakpoint length specification bits)
A 2-bit
LEN
field exists for each of the four break-
points.
LEN
specifies the length of the associated
breakpoint field. The choices for data breakpoints
are: 1 byte, 2 bytes, and 4 bytes. Instruction execu-