


KARMA GE guide
964
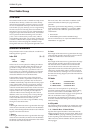
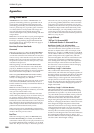
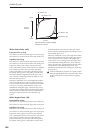
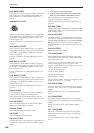
With a Positive Factor (+40):
Exponential Curve (Exp)
75% chance of a choice from the upper 10% of the pool;
25% chance of a choice from the lower 90% of the pool.
Logarithmic Curve (Log)
90% chance of a choice from the upper 25% of the pool;
10% chance of a choice from the lower 75% of the pool.
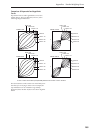
In general, as the positive factor increases, the Exp
Curve will produce choices more from the very highest
part of the pool, with a choice from the remaining
portion more likely to occur than with the Log Curve.
In contrast, the Log Curve will produce choices more
from the mid high to highest part of the pool, with a
choice from the remaining portion less likely to occur
than with the Exp Curve.
Therefore, while both curves will weight the random
choices toward the upper values in the pool, the Log
Curve provides less of a chance of the lower and center
values ever occurring, while allowing a more even
distribution among the upper values. The Exp Curve
provides more certainty that the highest values will be
chosen, while still allowing a more even distribution
among the center and lower values than the Log
Curve.
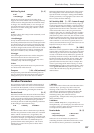
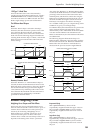
With a Negative Factor (-40):
Exponential Curve (Exp)
75% chance of a choice from the lower 10% of the pool;
25% chance of a choice from the upper 90% of the pool.
Logarithmic Curve (Log)
90% chance of a choice from the lower 25% of the pool;
10% chance of a choice from the upper 75% of the pool.
In general, as the negative factor decreases, the Exp
Curve will produce choices more from the very lowest
part of the pool, with a choice from the remaining
portion more likely to occur than with the Log Curve.
In contrast, the Log Curve will produce choices more
from the mid low to lowest part of the pool, with a
choice from the remaining portion less likely to occur
than with the Exp Curve.
Therefore, while both curves will weight the random
choices toward the lowest values in the pool, the Log
Curve provides less of a chance of the higher and
center values ever occurring, while allowing a more
even distribution among the lower values. The Exp
Curve provides more certainty that the lowest values
will be chosen, while still allowing a more even
distribution among the center and upper values than
the Log Curve.
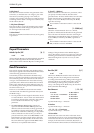
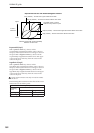
A Factor of 0 with any shaped curve yields a linear
table (straight diagonal line), and each of the values
in the pool will have an equal chance of getting
chosen.
Log (Factor +40)
X Axis =
Lower
Upper
maxmin
Y Axis =
The Pool
Exp (Factor +40)
Log (Factor –40)
Exp (Factor –40)
Random choice with equal probability
between min and max.